Solana plunged significantly in the last 24 hour and was now moving closer to its support line. Bearishness continued to be evident in the technical outlook for the coin. However, the coin attempted to bring the bulls home a few days before.
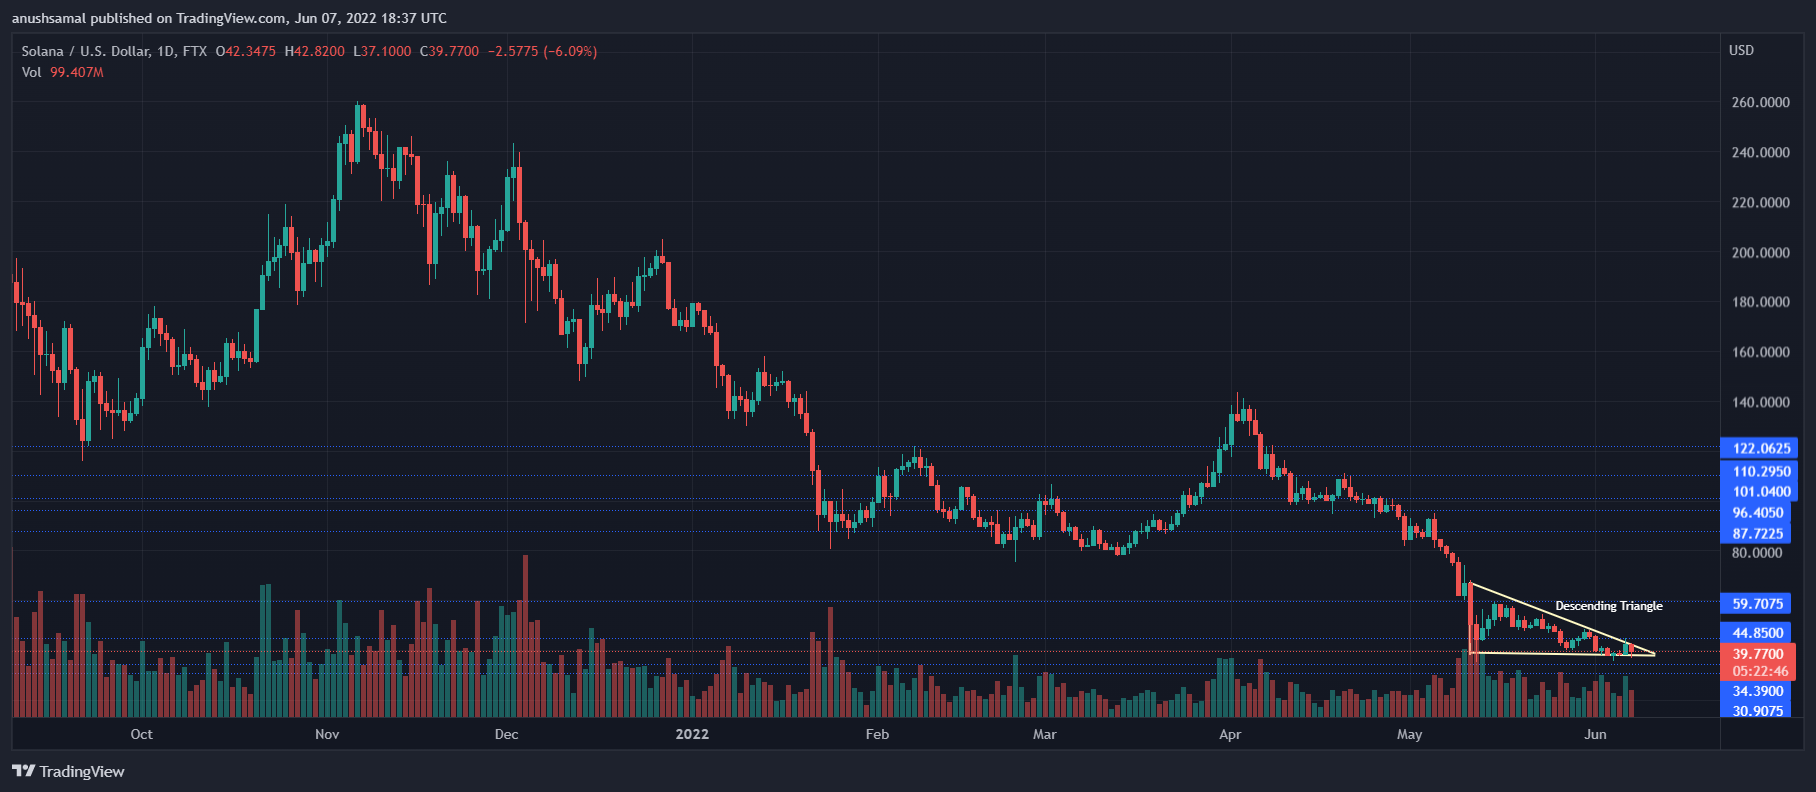
SOL traded at or near August 2021 levels as of the moment. The bulls lost and buyers also fled the market. Now, the price of the coin is at $38. Solana could again fall below the $38 mark due to the selling pressure of the bears.
At $44, major resistance remains for the coin. If SOL gains bullish momentum, then the coin could witness an extended upside during the current trading sessions. Today’s global cryptocurrency market capitalization was $1.29 Trillion. 2.6%Negative change over the past 24hrs
Solana Price Analysis: One Day Chart

SOL traded at $39 as of press time. However, the price managed to stay above its $38 support level. The bears are returning, so it is possible for Solana to target falling below the immediate support level. The closest support line to the mark of $38 was at $34.
SOL may also be targeting the $30 price support level, as the coin forms a downward triangle which signifies bearishness. Considering Bitcoin also slightly retraced on the chart, market weakness could be a reason why Solana’s upward movement could be stalled.
The coin’s overhead resistance was $44, which is a level above which altcoin could encounter resistance of $59. Red in colour, the volume of coin traded during the session was lower than usual. Charts showed bearishness as a result.
Technical Analysis

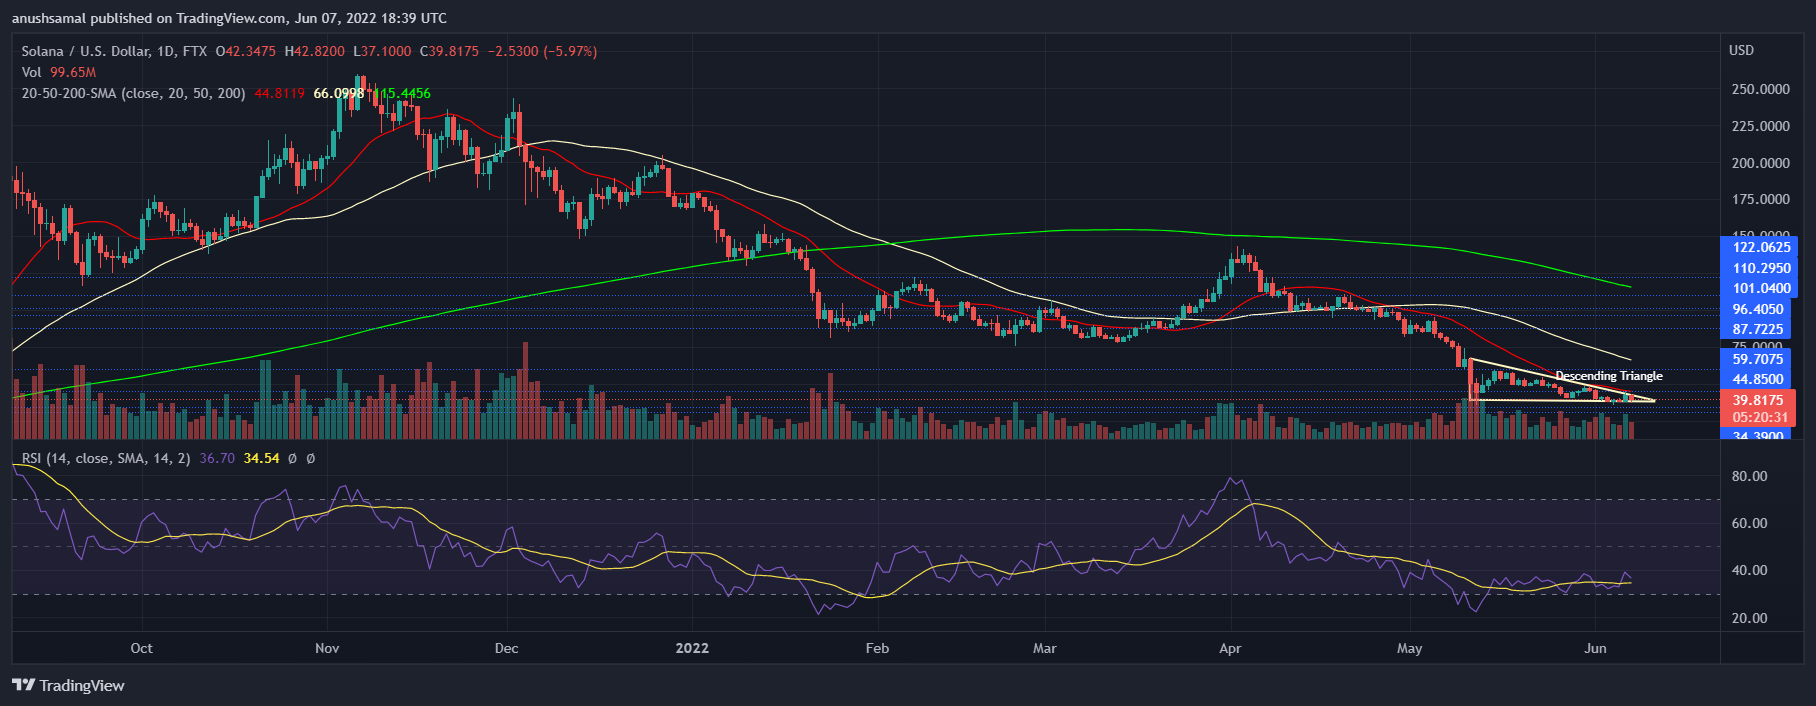
In the week that passed, altcoins were oversold. As such, press time saw the coin above the region in which it was listed. Although the coin was above the region of oversold, it still saw significant selling pressure from the recent drop.
Relative Strength Index recorded a decline, which indicated a shortage of buyers. SOL prices were below the 20 SMA lines, suggesting that sellers drove the market’s price momentum.
A continued selling trend will only increase the negative price action. However, Solana can be pushed with constant demand to push it above the 20 SMA line.
Related Reading | Short Position Piling Up, Could This Hint At The Next Bitcoin Move?

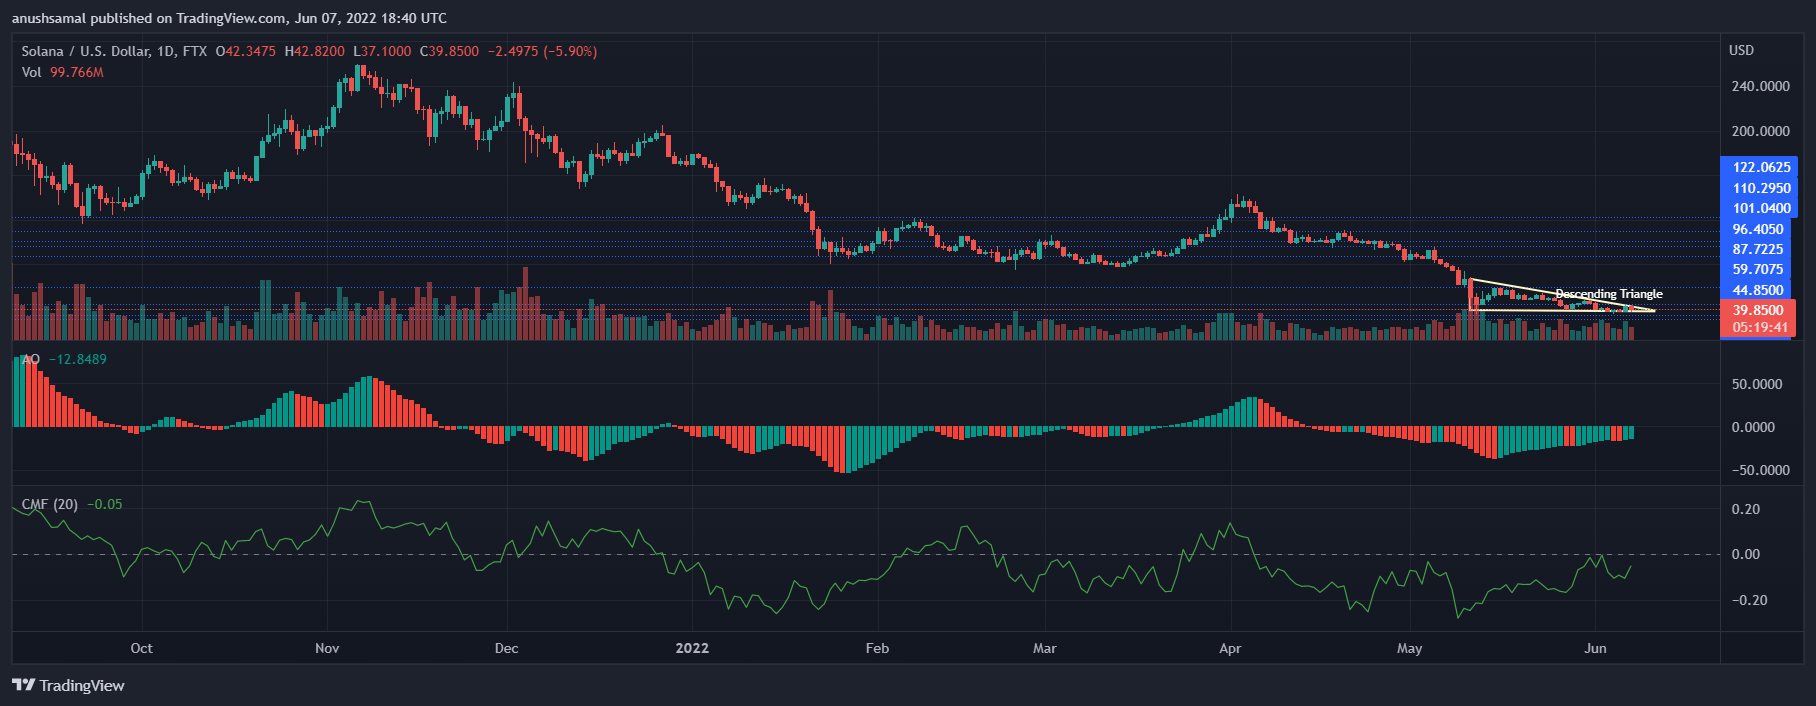
Technicals are showing mixed signals, with more bearish indicators. Chaikin Money Flow, which shows capital inflows and outflows, remained below the 50% mark.
This means that the capital outflows were greater than the inflows, despite the CMF increasing. A bullish indicator would be Awesome Oscillator blinking green signal bars.
This indicator depicts price momentum, and possibly a reversal.
Green signal bars indicate a buy signal. The signal could be followed by buyers and bulls may see relief.
Related Reading: Solana Under $40 in Network Outage. Are The Bears Back| Solana Below $40 Amidst Network Outage, Are The Bears Back?