The Solana Price rose by 8.8% in the past 24 hours. This chart is bullish. The altcoin’s price has increased by almost 17% over the past week.
Solana was one of the most successful gainers over the last week. Solana is now bullish and has broken through the $33 mark.
Also, it formed a bullish trend pattern which gave traders some hope. Solana may encounter resistance at $41 prices.
Numerous altcoins showed signs of optimism when Bitcoin began to rise on its chart.
As Solana demand soared, the technical outlook was favorable for bulls. Given the Solana price trend, traders have chosen to take a long position.
Solana is one of the best-performing crypto assets.
Despite high demand, if Solana doesn’t move past the $41 price mark, a fall to its closest support level is inevitable over the next trading sessions.
Today, the global cryptocurrency market is worth $1.12 trillion. 1.4%In the last 24hrs, there has been positive change.
Solana Price Analysis: One Day Chart

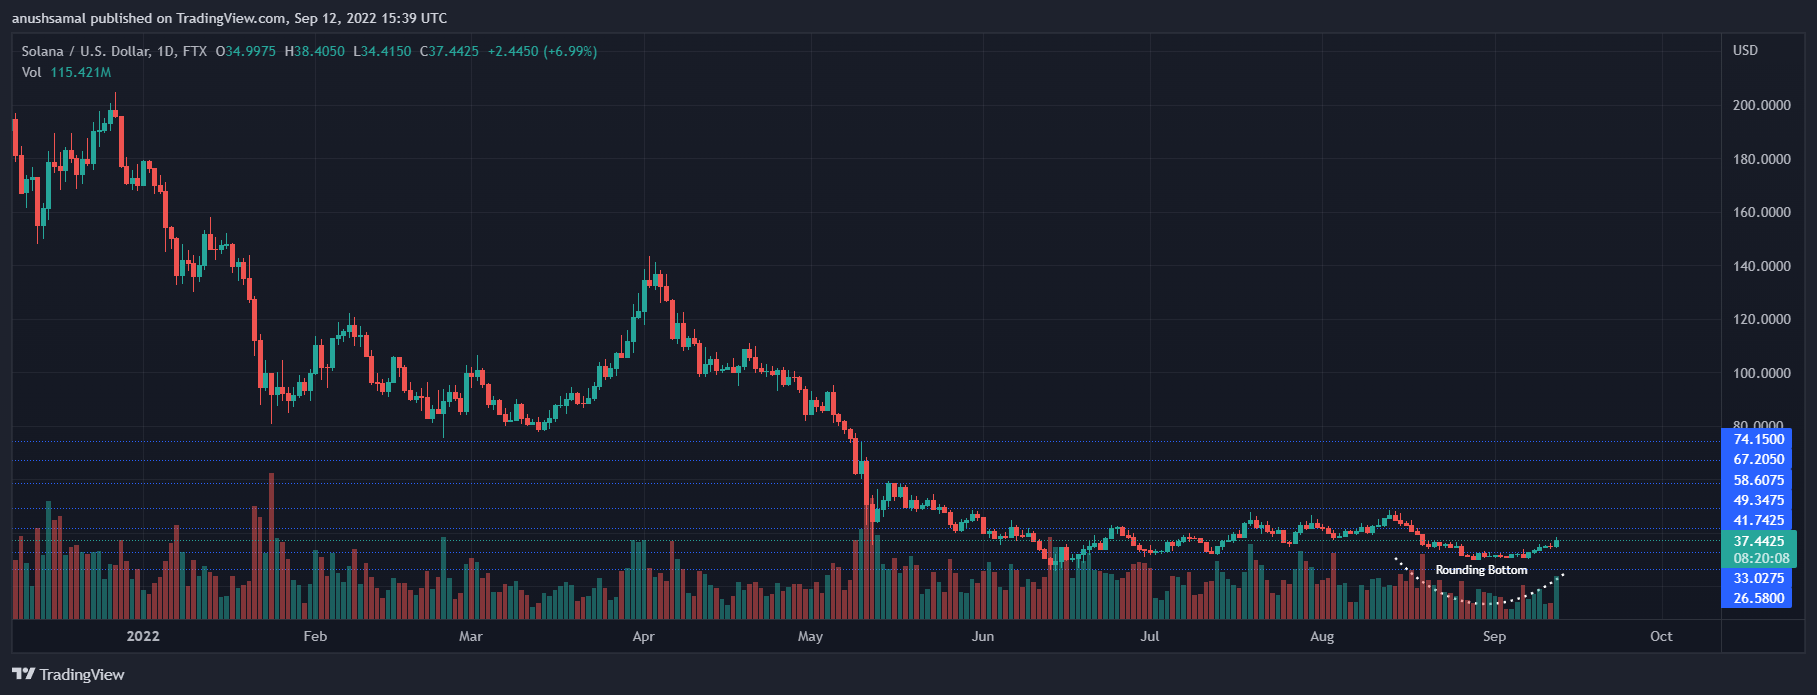
SOL traded at $37 as of the writing. SOL’s fluctuation has been between $33 to $49 for the past several months.
Solana accelerated 8% over the past 24hrs and created a rounding bottom.
This is a sign of bullishness, and an ongoing upward price trend.
Overhead resistance was $41, with a break at that level would bring Solana to $49.
Solana could reach a multi-month peak if he moves above $49
SOL would drop to $26 if it fell below the immediate support level of $33. In the previous session, Solana trade volume increased. This indicates increased buying power.
Technical Analysis

A rounding bottom indicates that the asset is bullish. It could remain this way for the next trading session.
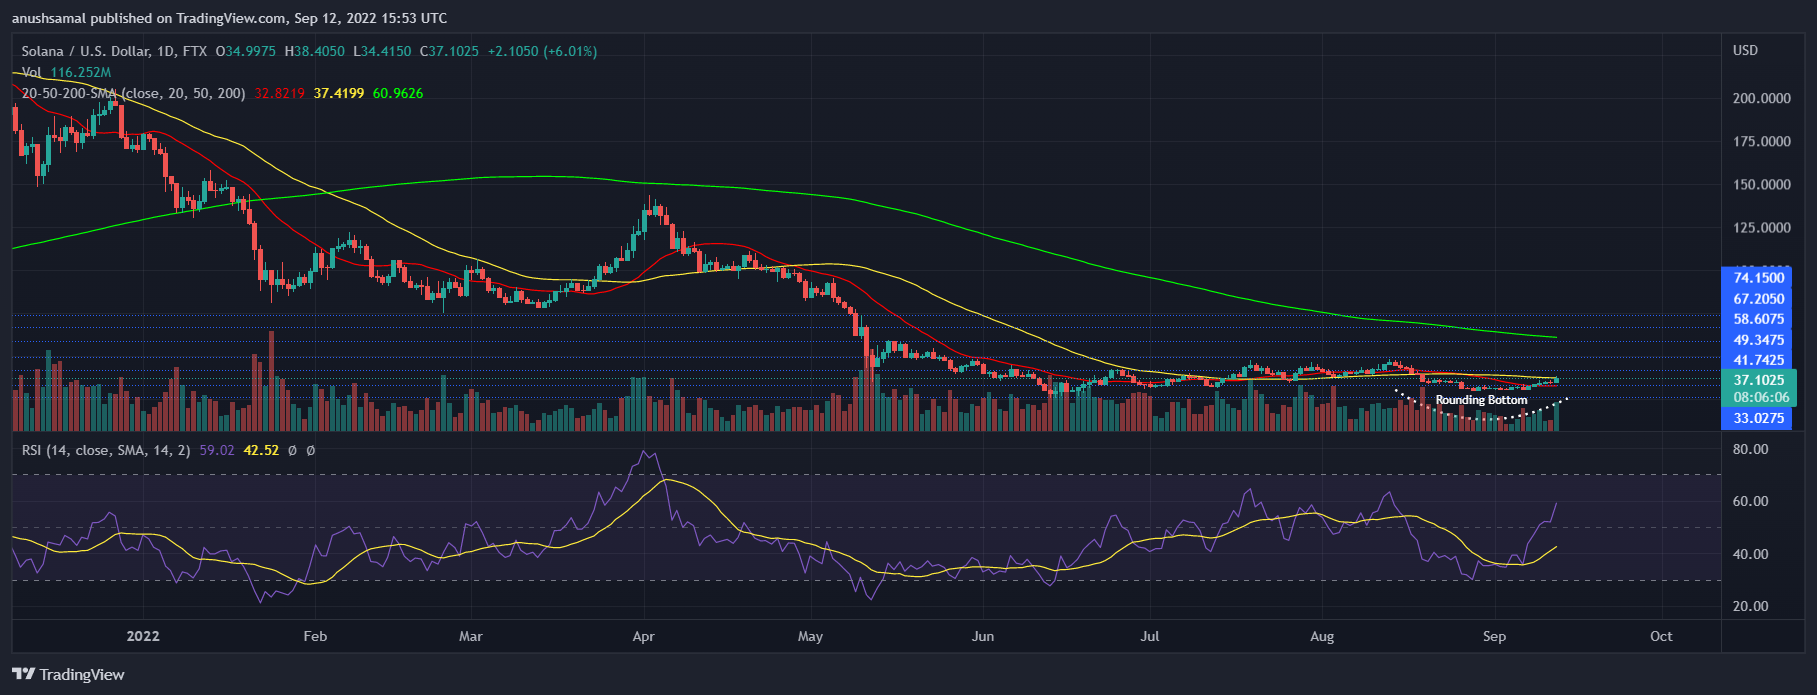
Solana was on the sidelines technical. Relative Strength Index rose above half-line which indicated increased buyers as compared with sellers.
Solana’s price also rose above the 20 SMA due to increased demand. The market was experiencing price momentum because of this reading.

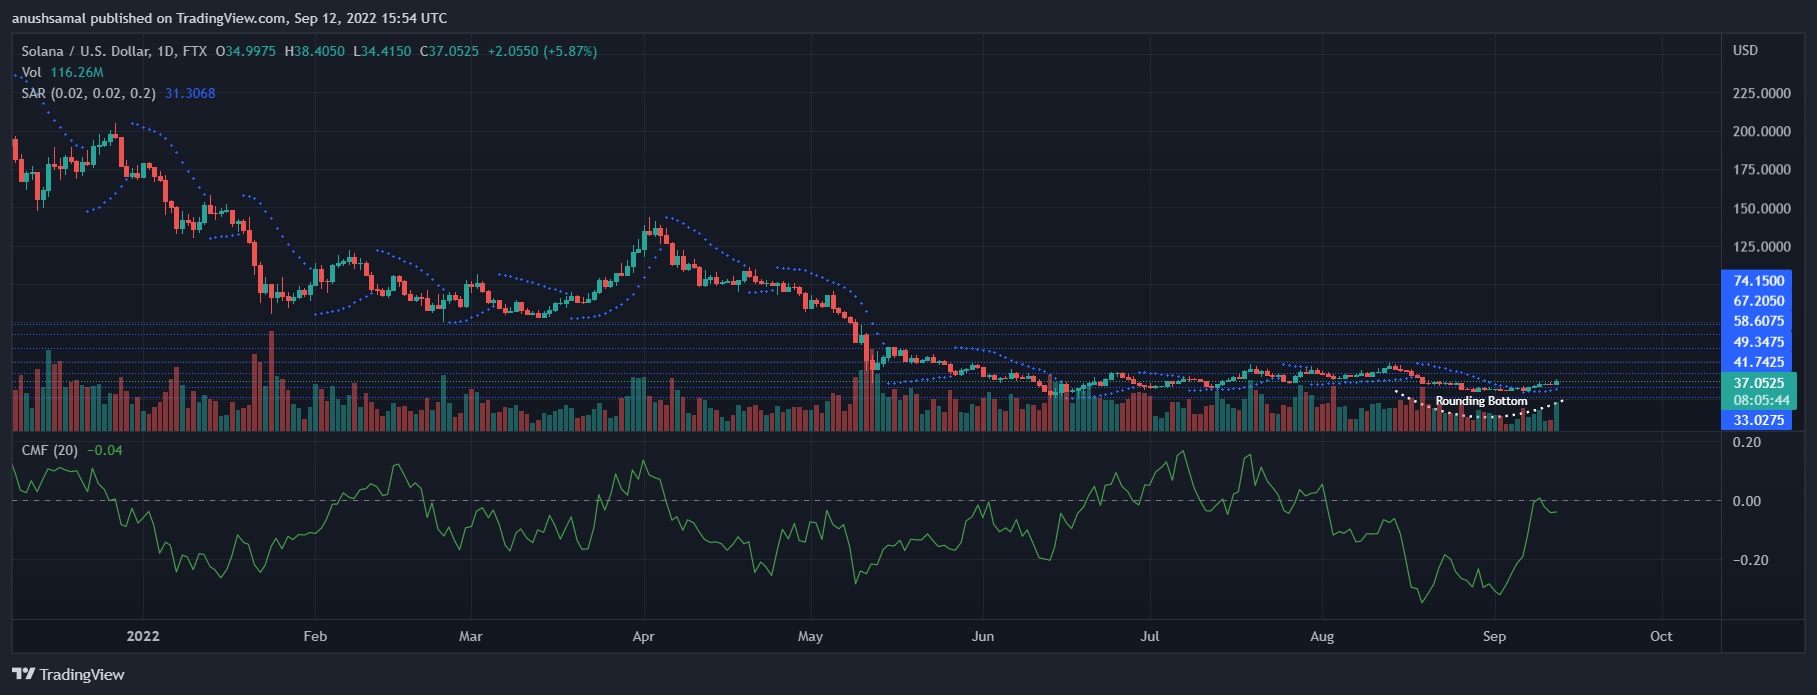
SOL’s other indicators have also indicated that there has been an increased demand over the past week. Parabolic SAR (which measures price momentum and direction) was also positive.
It was indicated by the lines drawn below candlesticks that Solana’s price would go up in the next trading session.
Chaikin Money Flow on the other hand was negative, which shows capital outflows relative to inflows.
CMF fell below the halfway line, which means capital inflows were lower than outflows as of the writing.
Similar Reading: Solana nears the 100 billion transaction milestone as price targets for $40
Featured image taken from The Gadgets 360 Chart by TradingView.com