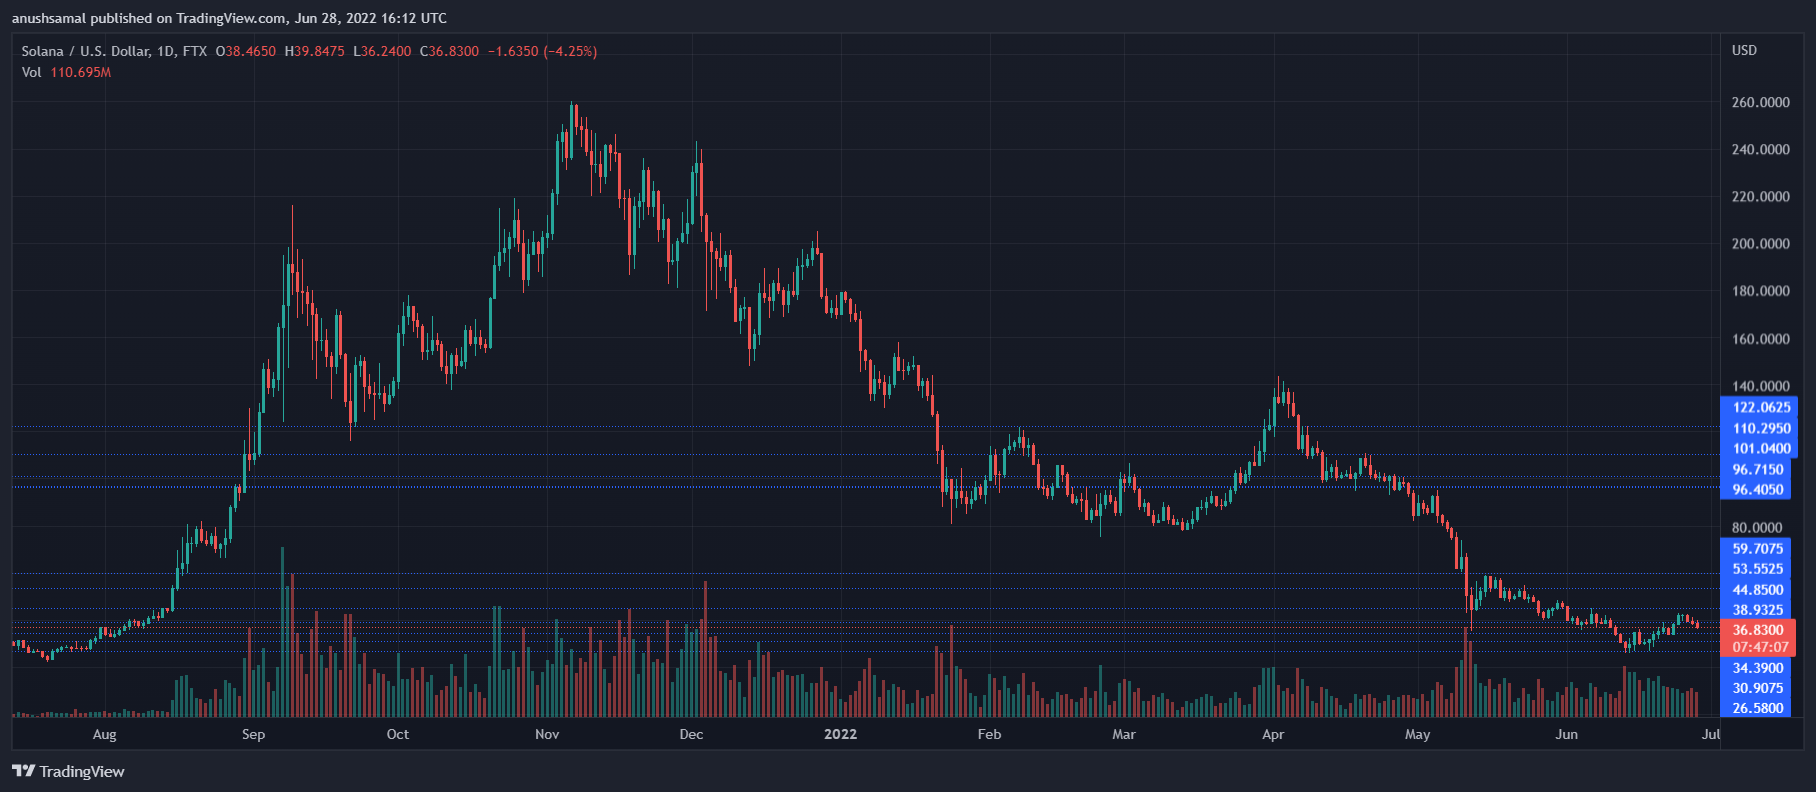
Solana fell by 2% over the past 24hrs. Over the last 24 hours, there has been strong bearish influence on SOL’s price. The current support level for the coin is $34.
Bitcoin, which has hovered around $20,000 over the past 24 hours has also seen the market taken over by bears. Others market mover have also reversed their moves in their charts.
The technical outlook for the coin points to negative price action, suggesting that Solana’s price could fall even further. SOL’s price could see a dip again as sellers have begun to push the market.
Global cryptocurrency market capitalization today stands at $977 billion. This is a 0.2% drop over 24 hours. SOL is now at risk for further decline, as Solana fell below $40.
Solana Price Analysis: One Day Chart

SOL traded at $36 during the 24 hours chart. The coin will reach $34 if it continues to retrace its current price levels. SOL currently has overhead resistance at $38, but if there is a rebound in buying strength, SOL may attempt to revise the price of $38.
SOL could reach $44 if it can stay above $38 for an extended period of time. Solana may drop as low as $26 if the support line of $34 is breached. It was trading in the red which indicated bearishness, increased selling pressure, and the amount traded.
Technical Analysis

The technical outlook for Solana on the 24-hour chart has indicated that price will continue to fall. The number of buyers declined, as we have already mentioned.
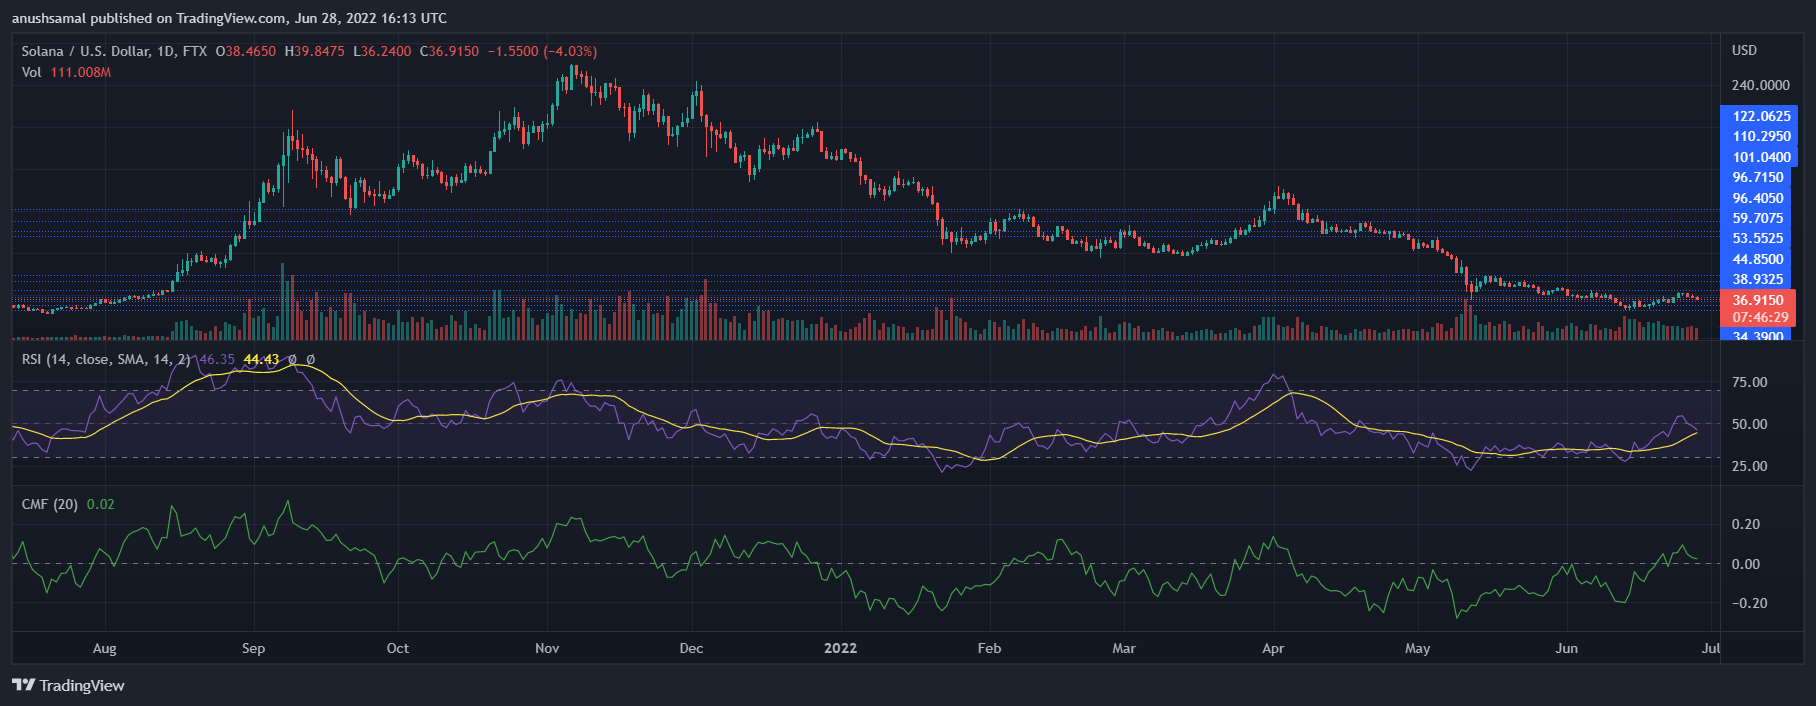
Relative Strength Index showed a decrease and fell below half-line. This indicates that there were more sellers than buyers on the market.
Chaikin Money Flow also changed to the zero-line in accordance with increasing selling pressure. This indicator shows capital outflows and inflows. This indicated that capital outflows decreased.

Solana is currently at a price that could see demand from buyers, if the level of the market remains the same. Despite the fact that the bears are now in control, SOL is flashing a buy signal on one-day charts.
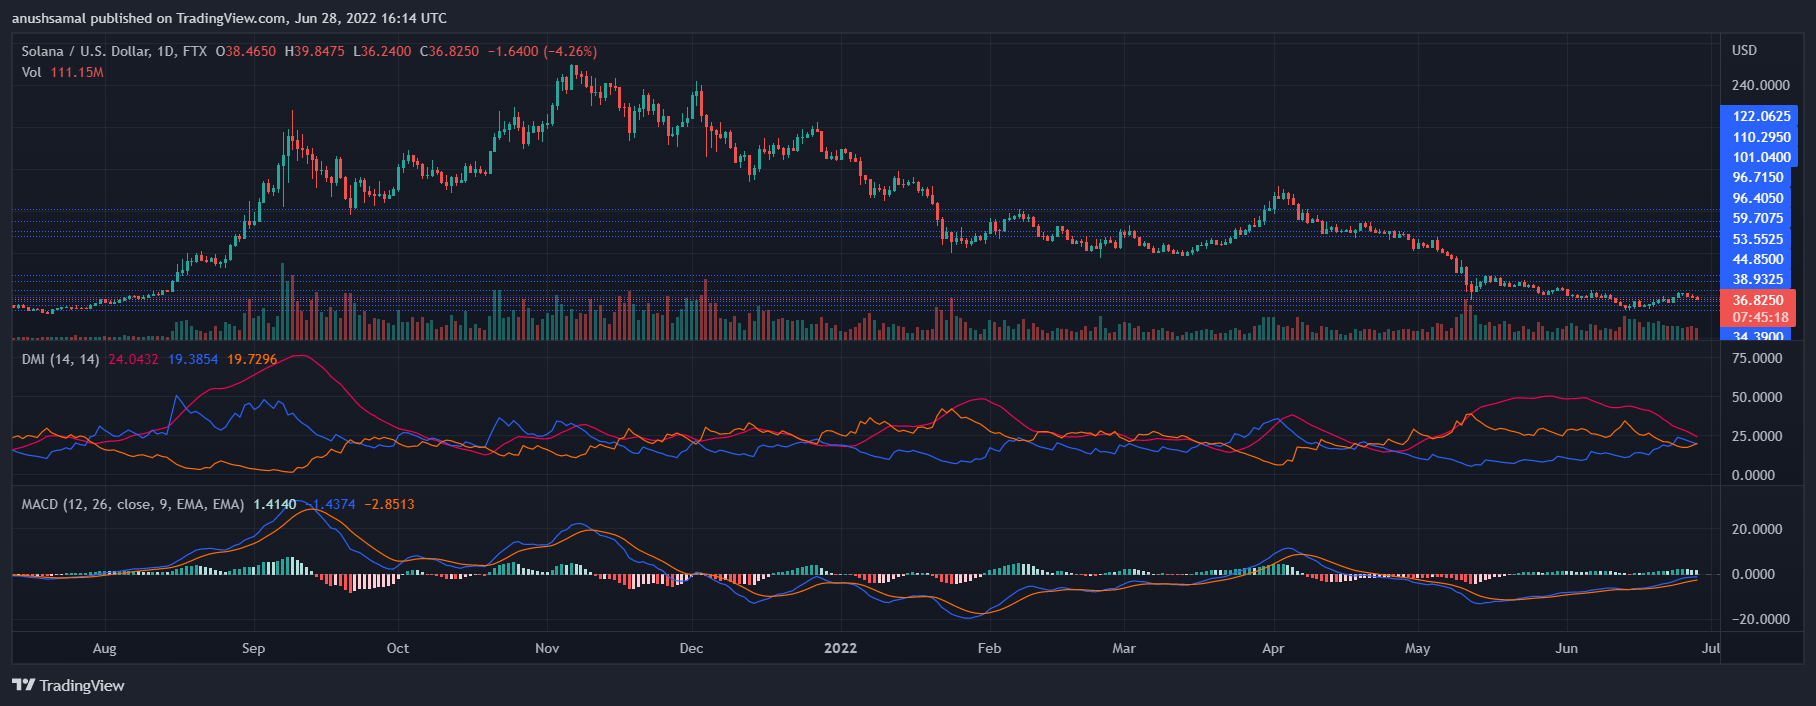
Directional Movement Index (DMI), which was negative, meant that price direction will remain bearish. The DMI showed that the -DI was higher than the +DI.
Moving Average Convergence Divergence depicts price trends as well as reversals. MACD displayed green histograms that are linked to a buy signal. To help SOL reclaim $44, it will be critical that buyers are strong.
Featured Image from Solana.com. Chart by TradingView.com