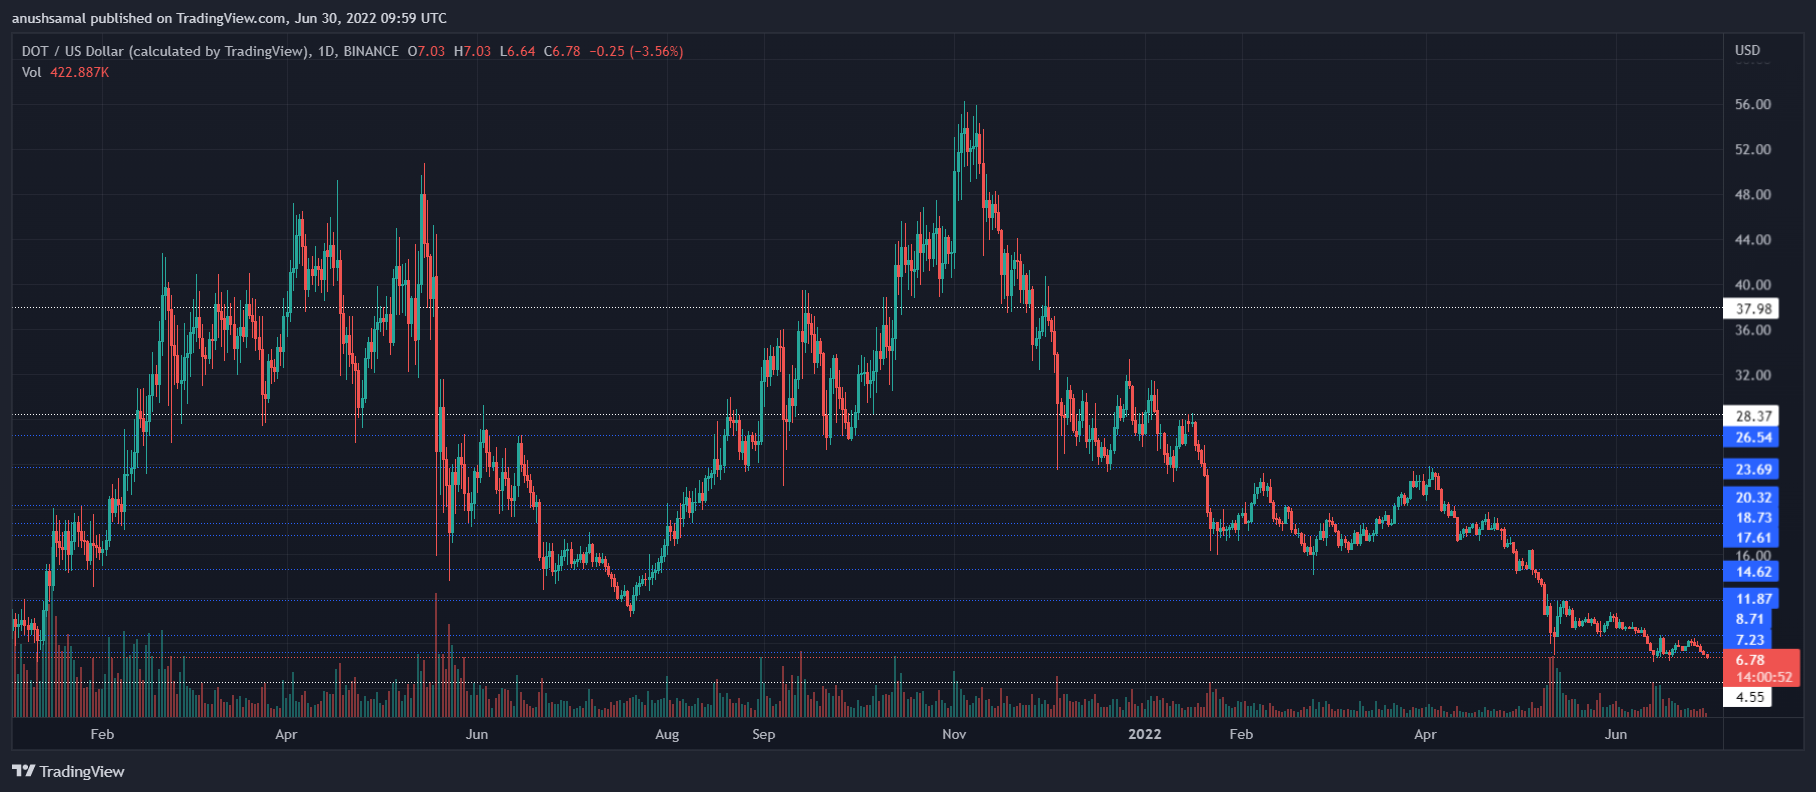
As the wider market continues to be weak, Polkadot’s chart shows a continuing downtrend. Over the past 24 hour, DOT lost almost 8% of it market value. This negates any weekly gains that DOT achieved. The technical outlook of the coin suggested bearish price action.
The coin may not be able hold the $6 support level. It has seen stiff resistance around the $7.20 level. The bulls may be back if they can trade the coin above $7.20 over a prolonged period.
Polkadot has introduced a new model for on-chain governance. The on-chain governance model was announced by Gavin Wood (founder of Polkadot) at the PolkadotDecoded 2022 conference.
The main goal of this model of governance is to improve the ability of governance structures to take collective decisions. This latest development has yet to impact the price of altcoin.
Polkadot Price Analysis: One Day Chart

At the time of writing, the DOT price was $6.76. At $6, the nearest support level for the coin can be found. So the sellers are now in control and the coin will soon fall below that price.
The $6 support level is a low point and DOT will be at a breaking point. The coin could trade close to the $4.20 support mark. The coin’s overhead resistance was $7.20 but it has been struggling to get above that level in the past few days.
If DOT experiences a price correction, and moves above the $7.20 mark, then DOT may be able to reach the $8.70 resistance level. The volume of DOT trades fell markedly, which indicates bearishness.
Technical Analysis

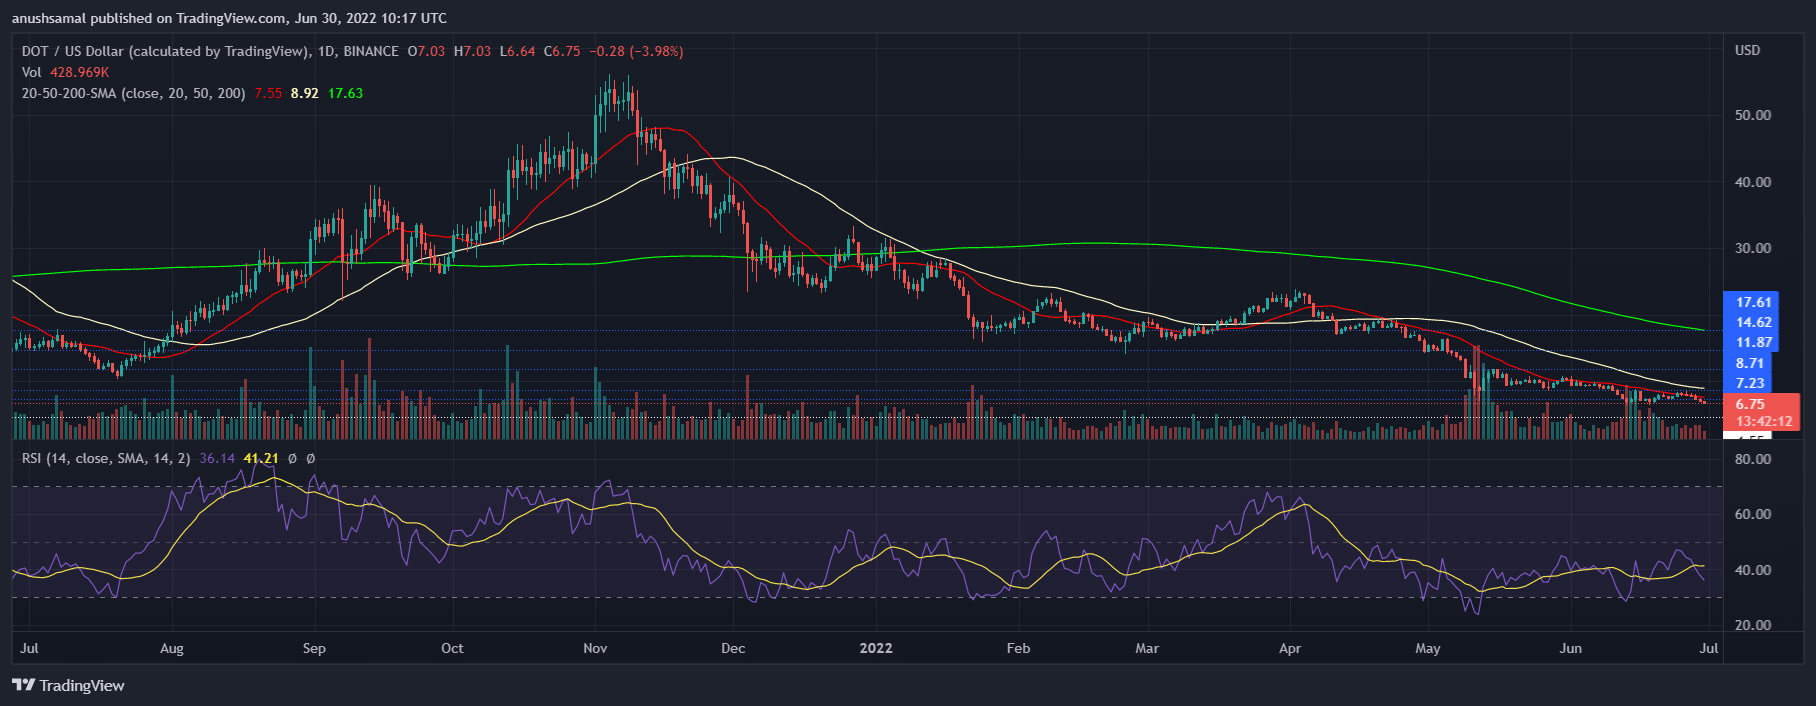
As DOT has become significantly bearish, buyers have exited market. Despite the price rebound, the purchasing strength was still weak.
Relative Strength Index fell below the half-line, suggesting sellers had outnumbered buyers. This would indicate that prices will continue to fall. According to the 20 SMA, the coin fell below the 20 SMA line. This suggests that sellers are taking over price momentum.
Ethereum Keeps Sliding Down, Will The Support Line of $1,100 Break?| Ethereum Keeps Sliding Down, Will The Support Line of $1,100 Break?

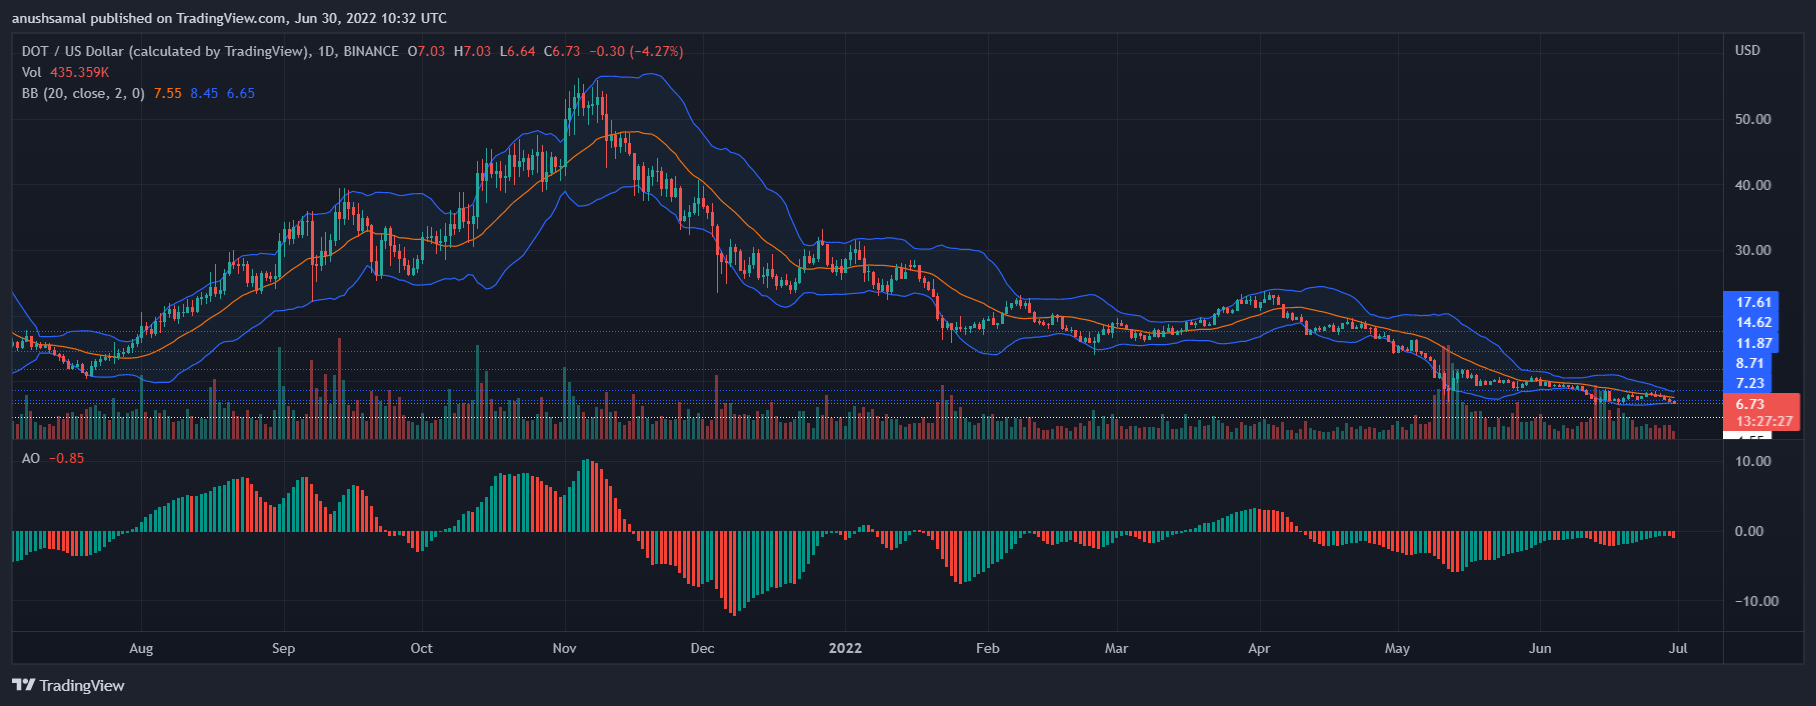
Due to increasing selling pressure, the chart had flashed sell signals. Awesome Oscillator shows price changes and reverses in real time. This indicator created red signal bars that are linked to the sell signal.
Bollinger Bands depict market price volatility. The Bollinger Bands narrowed significantly, which indicated that the market would see a lot of volatility over the coming trading sessions. Technical outlook suggests that it is possible for the coin to break its support level and trade at an all-time low.
Related Reading | Bitcoin Records Worst Performance For June, Will It Get Better From Here?
Featured Image from Currency.com. Chart from TradingView.com