
Ethereum’s price has fallen below $1.3k but it is not over yet. On-chain data suggests that the market is still under selling pressure.
Ethereum Exchange Inflows have continued to rise during the past day
CryptoQuant analyst points out that spot and ETH derivatives inflows remain high.
The “exchange inflow” is an indicator that measures the total amount of Ethereum entering into the wallets of centralized exchanges.
This metric is available in two forms. The first records the inflows to derivative exchanges while the second registers transfers to spot exchanges.
A rise in derivative inflows generally leads to greater volatility in the markets, since it indicates that futures positions are expanding and leverage is rising.
Spot inflows spikes could have a direct negative effect on the cryptocurrency price as crypto investors typically deposit money to these exchanges to sell their securities.
Below is a chart that displays the change in both the Ethereum Exchange Inflow Indices (7-day Moving Averages) during the past year.
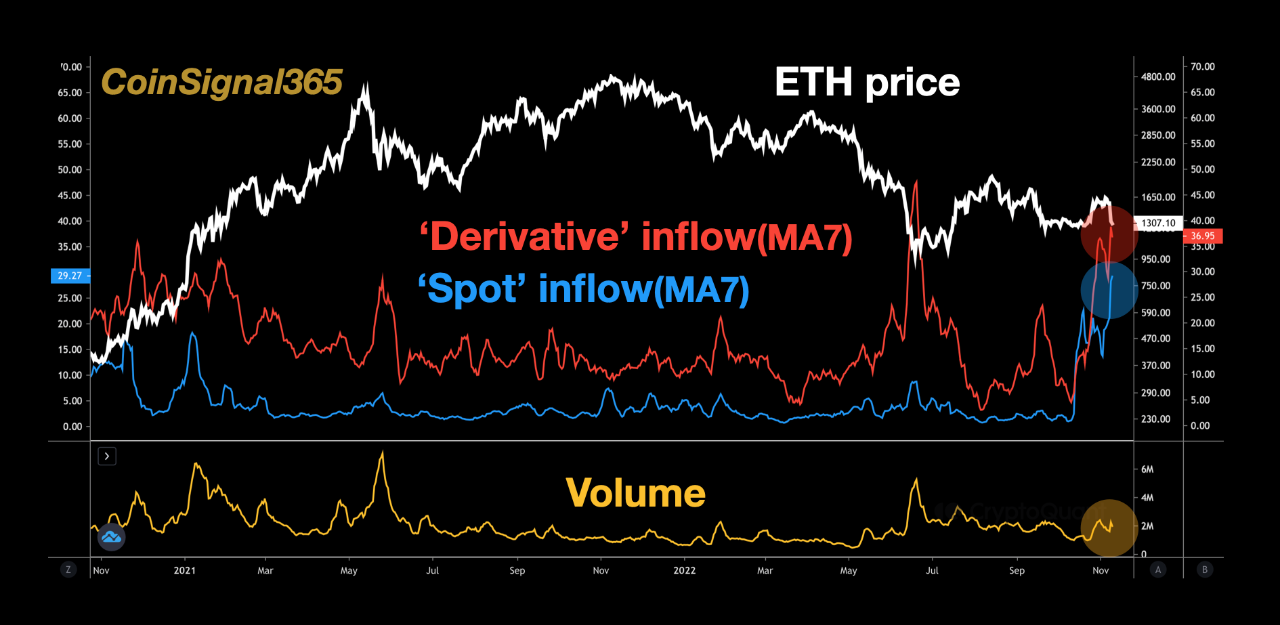
These metrics' 7-day MA values seem to be quite high. Source: CryptoQuant| Source: CryptoQuant
The graph above shows that both types of Ethereum inflows spiked just prior to the market crash.
The price of crypto fell to $1.6k, and now it is at $1.2k.
This crash was triggered by Binance’s battle for FTX. Binance has since bought FTX.
However, it looks like the inflows still haven’t cooled off yet. The indicators actually seem to be increasing in number.
This suggests that Ethereum is continuing to experience selling pressure, a sign that the current level may not be the bottom, and the crypto’s value might observe further decline in the coming hours.
ETH price
At the time of writing, Ethereum’s price floats around $1.2k, down 21% in the last week. In the last month, crypto prices have dropped by 8%.
Here is a chart showing the trends in coin price over the last 5 days.

Source: ETHUSD on TradingView| Source: ETHUSD on TradingView
Featured image by Kanchanara at Unsplash.com. Charts from TradingView.com and CryptoQuant.com.