Over the past 24 hours, Ethereum prices experienced a new decline. In the last 24 hours, the price of altcoin dropped by 7.7%. ETH has fallen by 9% in the last week and traded below its support level at $1,520.
The broader market weakness could be blamed for most major altcoin’s southward movement on their respective charts.
The Ethereum price tried to stay above the immediate resistance but was met by a substantial sell-off.
It also showed a bearish technical outlook. As soon as ETH did not defend its immediate support level, buyers exited market.
ETH might continue to fall on the chart if the coin doesn’t manage to trade above the $1,400 price level. Bitcoin fell to $19,900 which caused some sellers to get more active on the market.
If the Ethereum price falls below the $1.400 level, it will remain at the $1.367 level. To break the bearish thesis, altcoin will need more market support and purchasing power.
Ethereum Price Analysis: Four Hour Chart
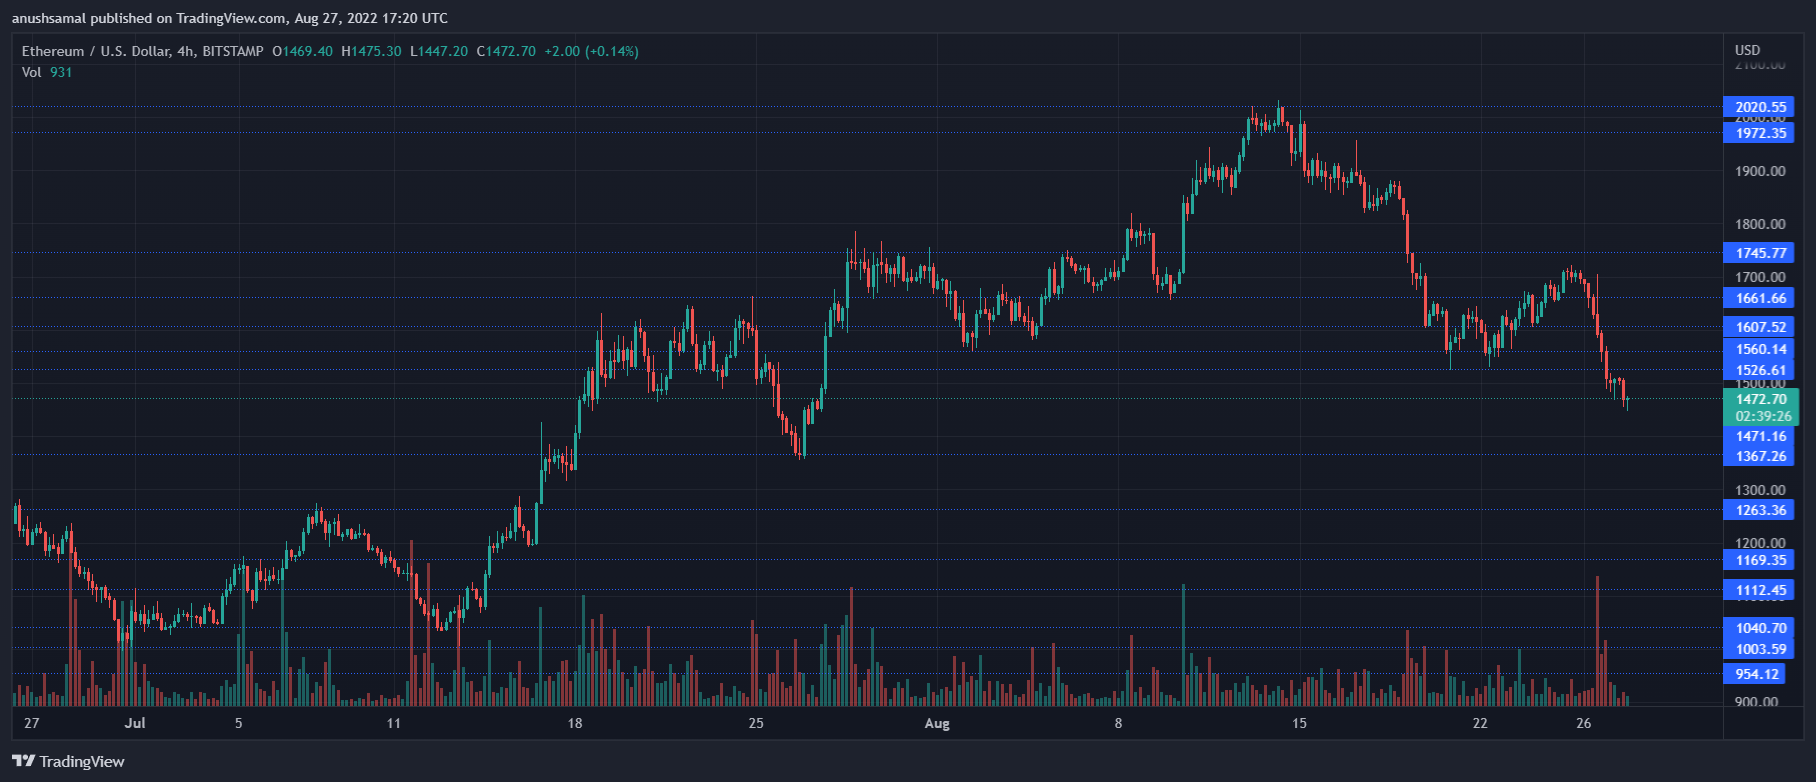
At the time of writing, ETH was traded for $1470. Altcoin has tried to recover on its chart, and the current price movement may be an indication of a correction.
After Etheruem’s price dropped below $1,500, the selling pressure increased. At $1,400 the immediate support level was set for the coin.
Ethereum could still be saved if it remains at $1,400.
Bearish price action will continue until Ethereum prices move above $1,500. Increased selling power is evident by the decrease in the amount of ETH that was traded.
Technical Analysis
On the 4-hour chart, ETH was too expensive. Bitcoin’s sudden excessive sell-off had caused buyers to lose confidence in the asset and major altcoins followed the same path.
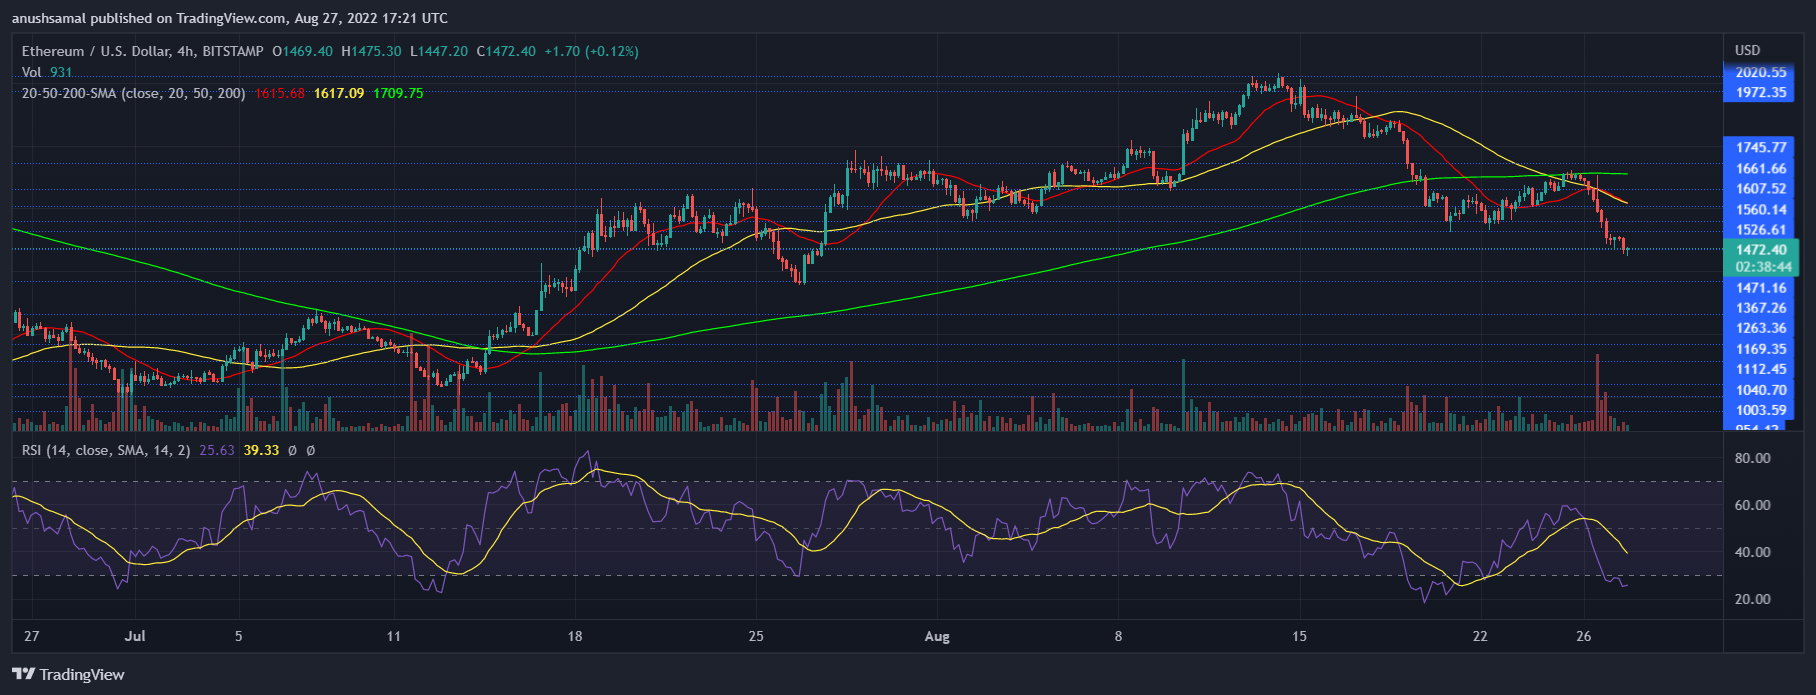
Relative Strength Index fell below 20 and indicated that the coin was in oversold condition.
Ethereum prices were below the 20 SMA lines, which means that the sellers are driving price momentum.
The altcoin’s selling strength increased over the last 24 hours. Oversold signals were also displayed by technical indicators.
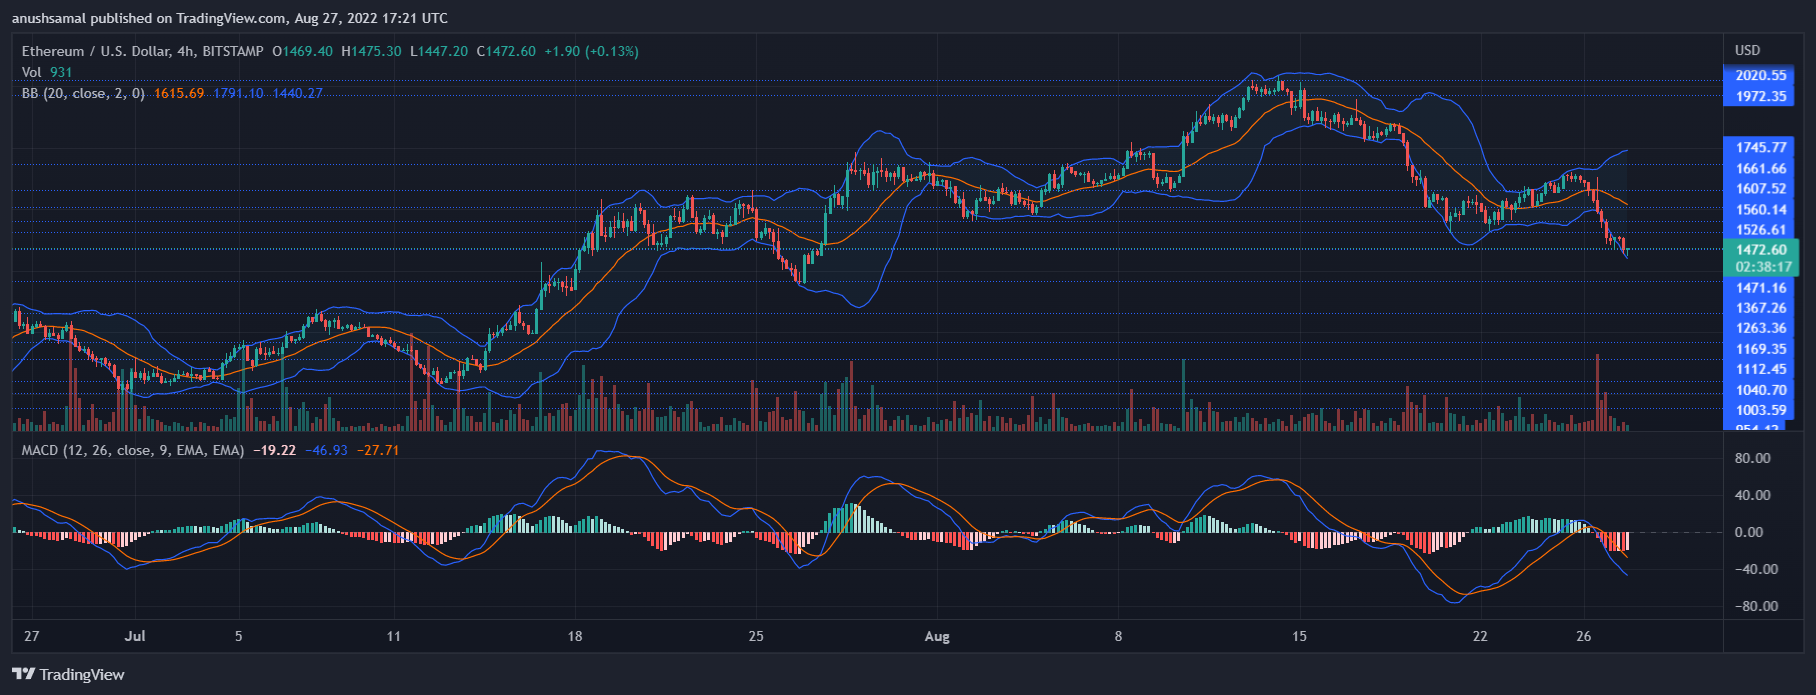
The Moving Average Convergence divergence shows price momentum as well as the possibility of a reversal. MACD was subject to a bearish crossover. It formed red histograms below the half-line, which were sell signals.
Bollinger Bands signify price fluctuations and volatility. As press time approached, the gap between bands increased, indicating increased price volatility. The coin must move beyond the current price ceiling in order to show signs of relief over the coming trading sessions.
Featured image from UnSplash - Charts From TradingView.com