
The Ethereum price has shown a recovery of 20% in 24 hours following consolidation near the $1,800 mark. Over the past week, ETH has seen a 20% increase. The king altcoin has had a strong week. It has almost been two months since altcoin was last traded at this level.
Although it failed to surpass the $1900 area, Ethereum price had quickly retraced. Support line at $1,600 was the solid support level for Ethereum price. Ethereum prices could see a dramatic change when the Ethereum Merge launches next month.
Merge, the shift from proof-of work to proof-of stake has been highly anticipated by the Ethereum community. This shift from proof-of-work shall diminish the altcoin’s power consumption by almost 99.5%. Ethereum will reach the $2,000 price ceiling if the price stays above $1900 for a significant amount of time.
Ethereum Price Analysis: 4 Hour Chart
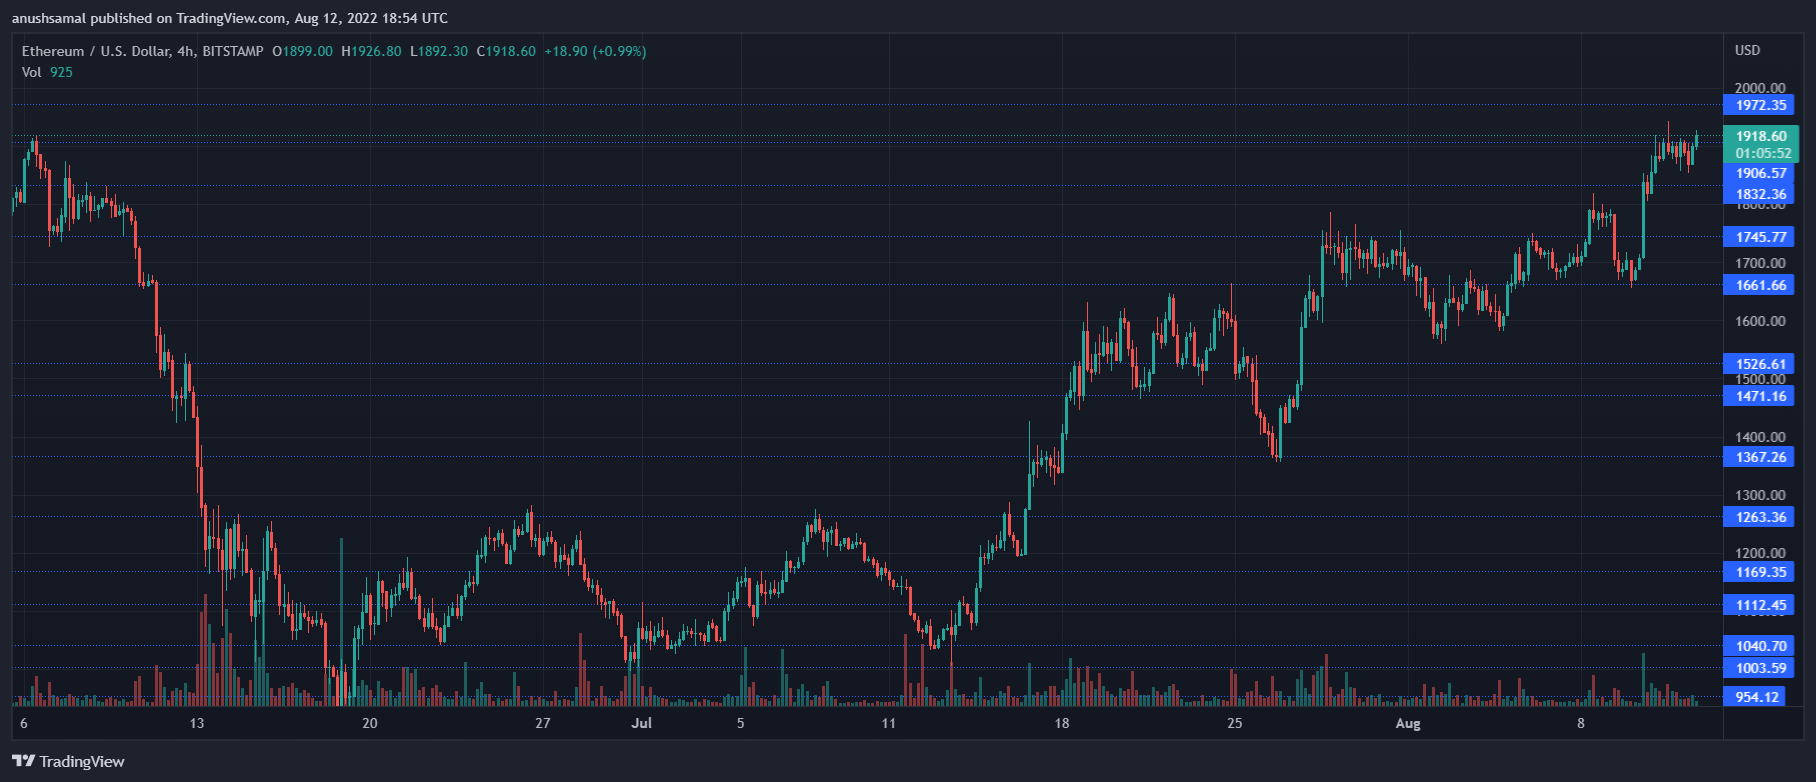
At the time this article was written, ETH traded at $1.918. The $1,800 price mark was finally crossed by the coin. Ethereum’s price must remain above $1,900 in order to reach $2,000
At $1,970 the overhead resistance of the coin. The local support level was $1,700, and $1,600, respectively. If ETH falls below $1,600, it can lead to a collapse in vigour that could cause the price to drop to $1,300. Ethereum was trading at a falling rate during the session. This meant that there was a decrease in selling pressure.
Technical Analysis
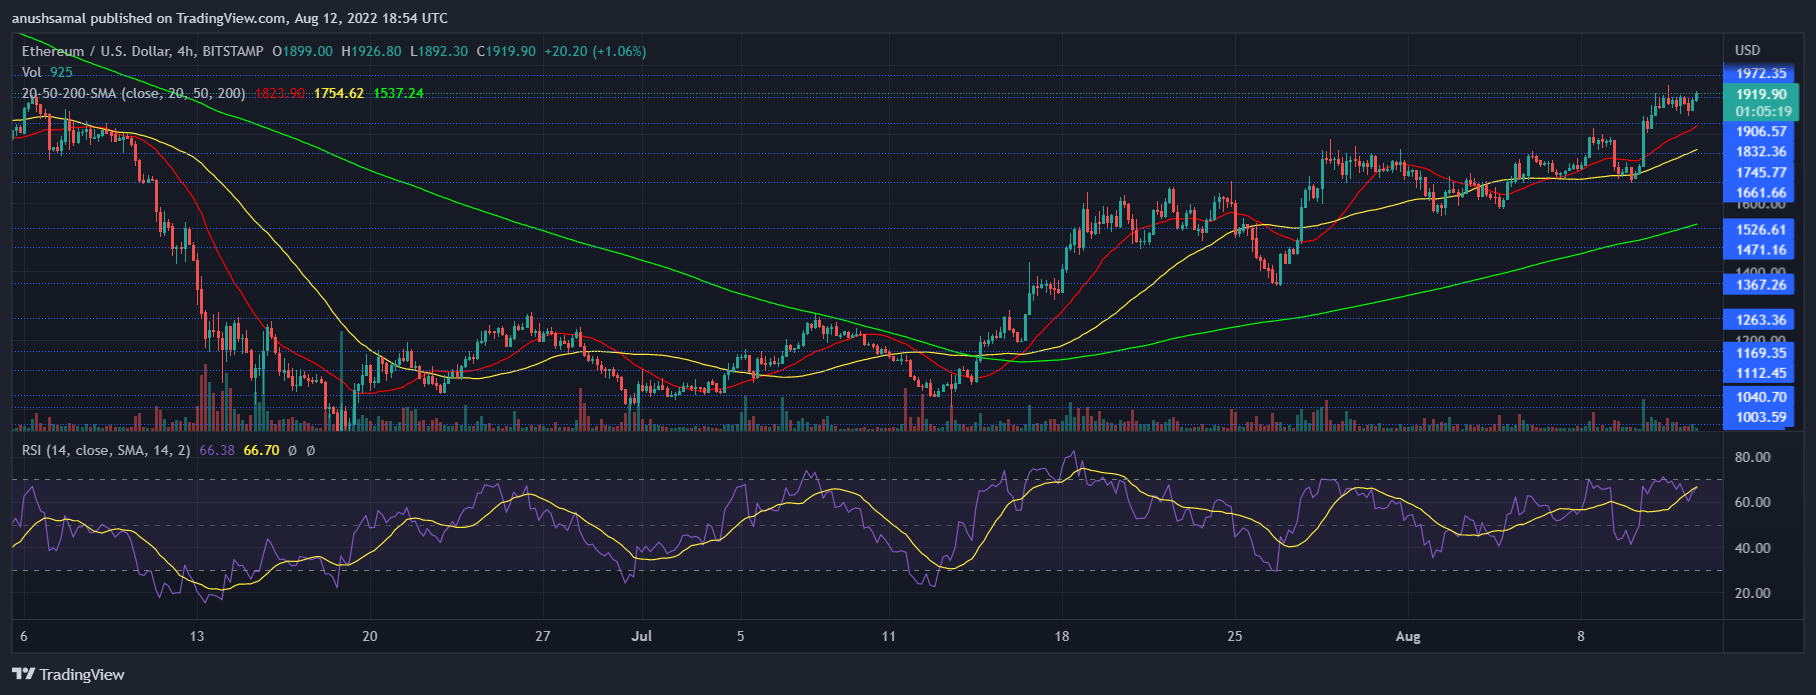
The altcoin’s technical outlook depicted bullishness on the four hour chart. The Ethereum price rose, indicating that buyers were buying more Ethereum. Relative Strength Index hovered above the 60 mark, which indicates that buyers were the dominant market participants at press time.
The possibility of a price pullback could occur if the demand for ETH keeps rising. The Ethereum price was higher than the 20-SMA level, which indicated that buyers drove the price momentum. Also, the altcoin price was above the 50 SMA line. This indicates that the asset is on the rise.
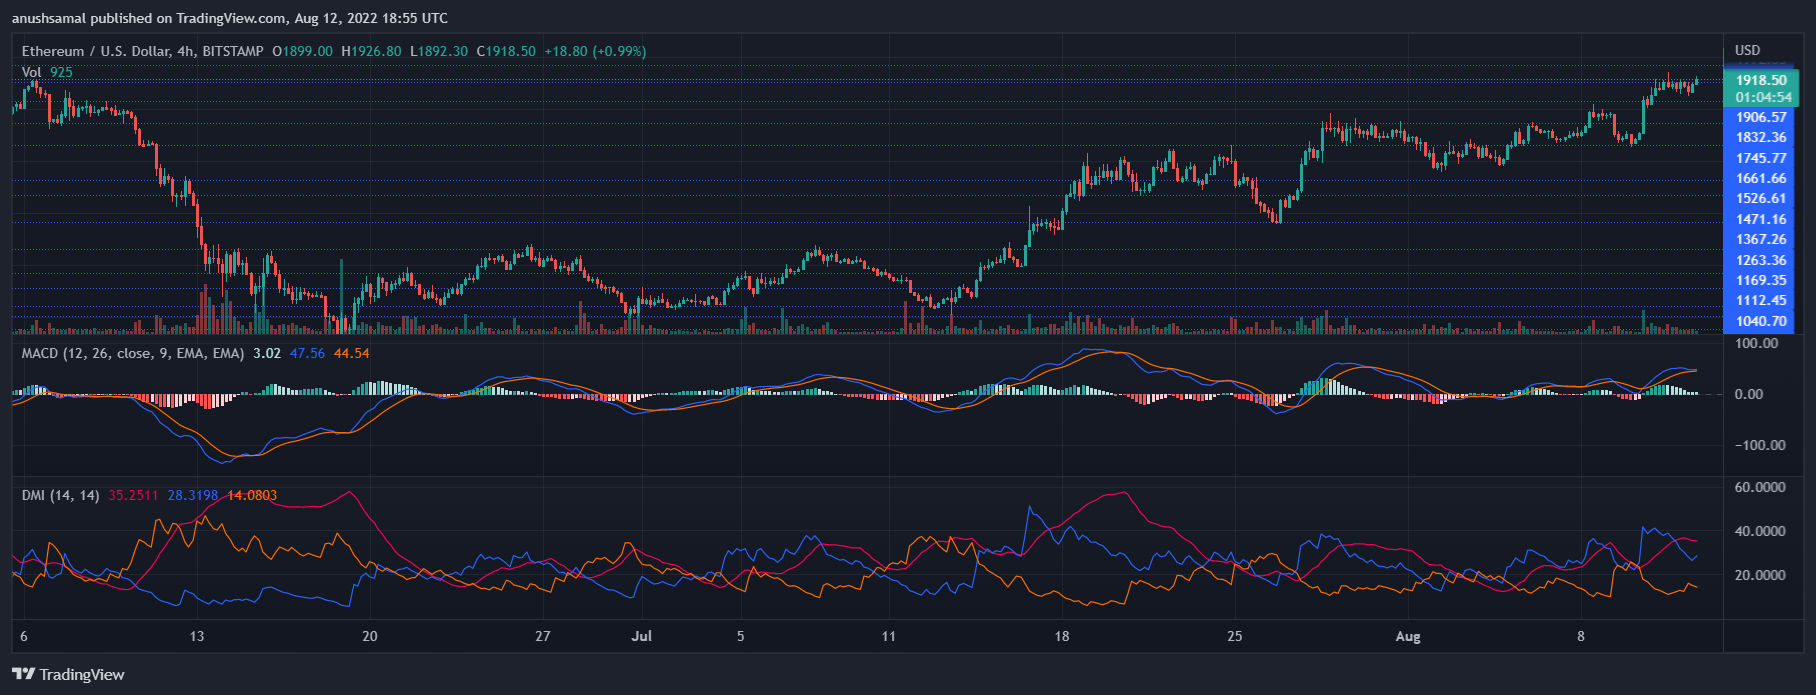
ETH’s other important indicators also depicted positive price action. The Moving Average Convergence divergence indicator is meant to show price momentum, as well as reversals. MACD registered a buy signal with a bullish crossover. It flashed green signals bars at the top of the line, which is the halfway point.
Directional Movement Index determines the direction in which Ethereum’s price will move. The +DI line was higher than the -DI, which indicated that DMI was positive. Average Directional Index Red (Red), was at the border of the 40 mark, which indicated that the current price direction had been gaining strength.