The on-chain data indicates that Bitcoin investors were afraid to take risks in recent days as the leverage ratio has remained low.
In the last few days, Bitcoin leverage ratio has remained low
As pointed out by an analyst in a CryptoQuant post, investors haven’t taken much risk since the surge in the crypto’s price a few days back as leverage in the market is low at the moment.
A relevant indicator here is the “open interest,” which shows the total amount of Bitcoin futures contracts currently open on all derivatives exchanges.
The “estimated leverage ratio” is a metric that’s defined as the ratio between this open interest and the total amount of coins present on all derivatives exchanges (exchange reserve).
This ratio shows us the amount of leverage each Bitcoin futures investor currently uses.
If the value is too high, users may be taking on significant risk. Such values can result in higher price volatility.
Glassnode’s RHODL Ratio May Suggest Bitcoin Market Is Near Capitulation| Glassnode’s RHODL Ratio May Suggest Bitcoin Market Is Near Capitulation
On the other hand, low values of the ratio indicate investors aren’t using much leverage currently as they look to avoid risk.
Here’s a chart showing the Bitcoin leverage ratio trend over the last few days.
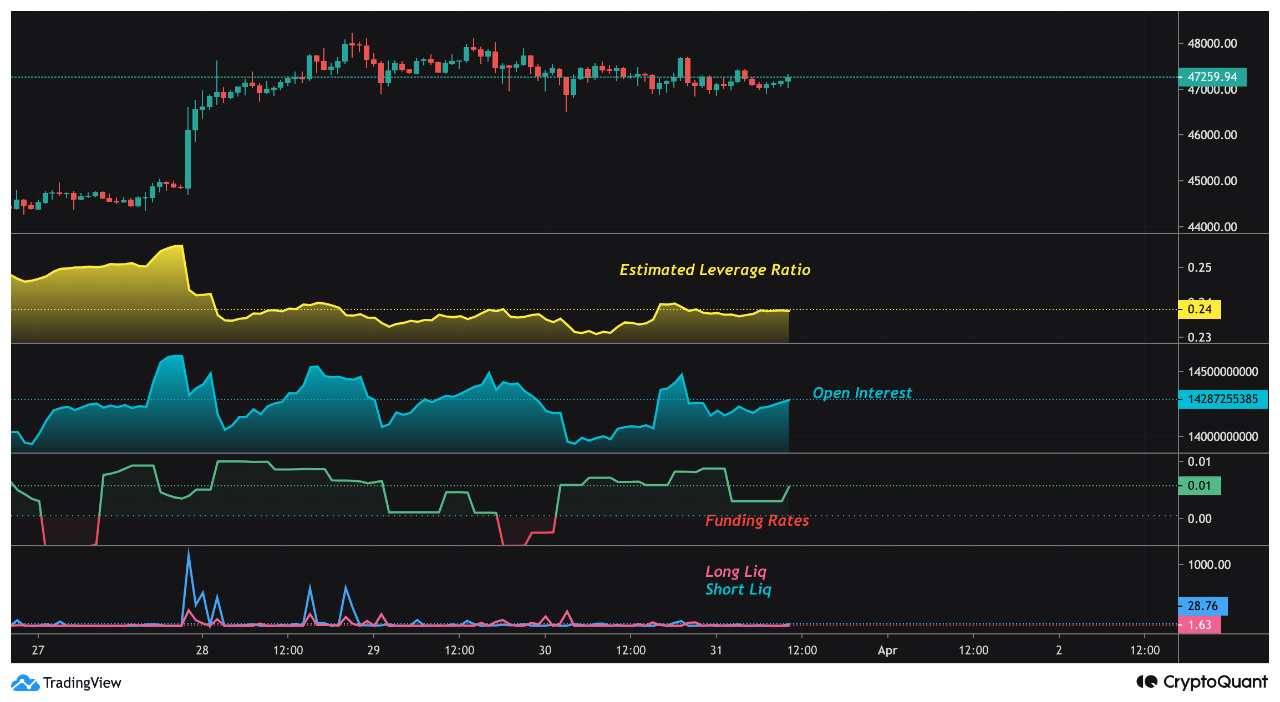
The value of this metric seems low right now | Source: CryptoQuant
As you can see in the above graph, the Bitcoin leverage ratio had a high value a few days back, but the sharp uptrend in the crypto’s price brought it back down as it liquidated shorts.
Since then, the indicator’s value has remained at these low levels. Open interest on the other side is high, which indicates that new investors continue to open positions in the market.
Read Related Articles| Time To Be Fearful? Bitcoin Index at its best point since Peak
The ratio shows that these positions are not subject to high average leverage. This suggests that many investors were uncertain about crypto and chose to accept less risk.
Also, the chart displays the curve of funding rates. This indicator tells us how many longs are in the market. The metric currently appears to be positive. This means that there are more long positions on the market.
BTC Prices
At the time of writing, Bitcoin’s price floats around $47k, up 10% in the past week. Below chart displays the trends in bitcoin’s prices over the last 5 days.

Source: BTCUSD on TradingView| Source: BTCUSD on TradingView
Unsplash.com's featured image. Charts by TradingView.com. CryptoQuant.com chart.