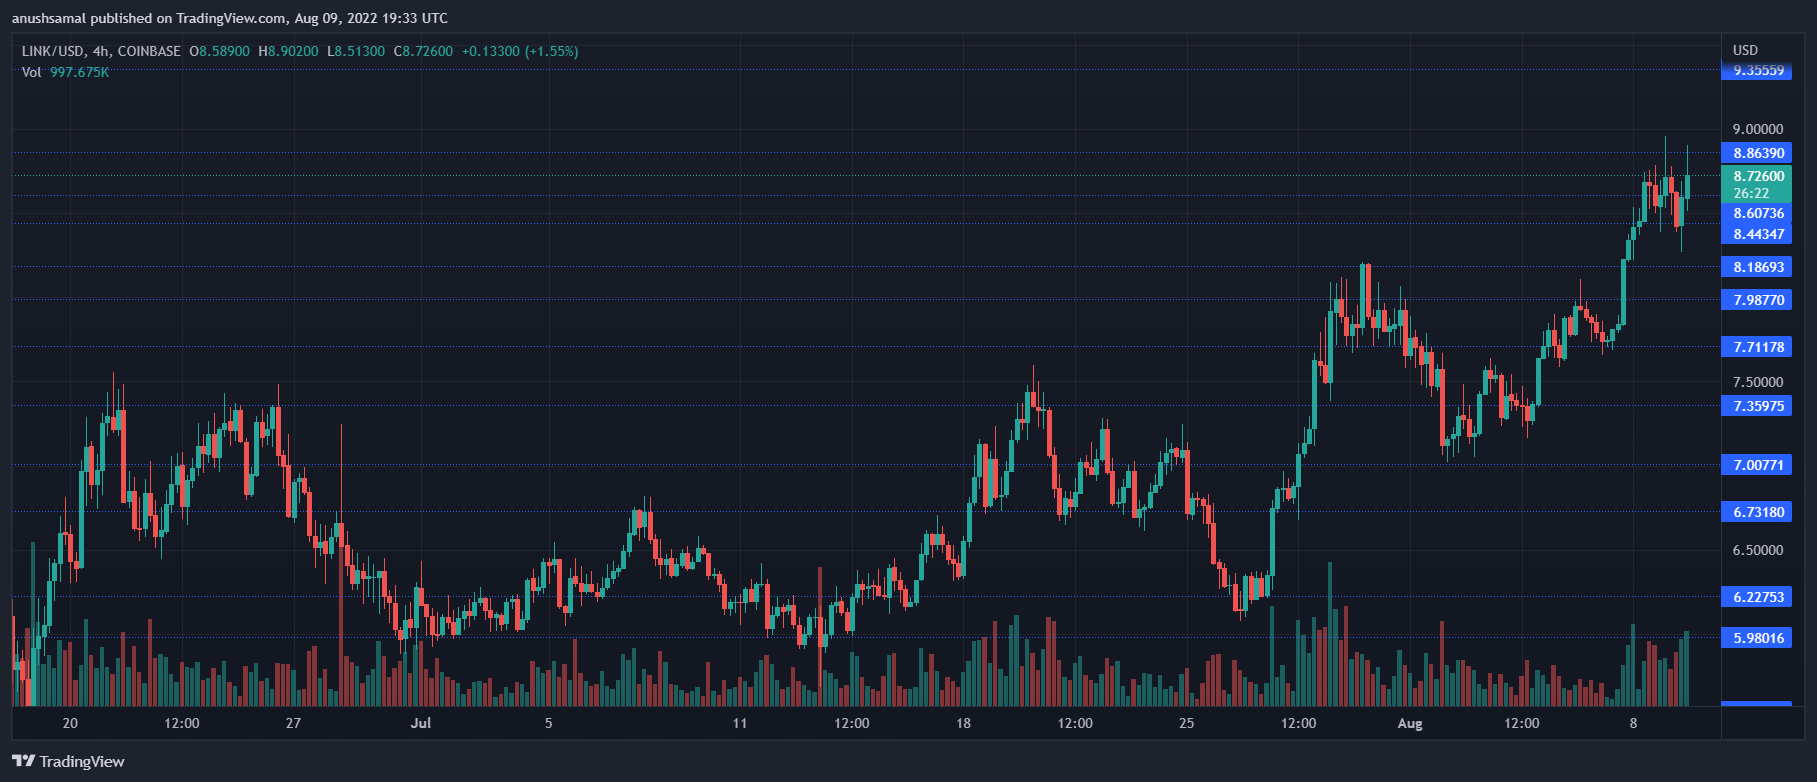
Over the last few trading sessions, Chainlink has traded in an upward channel. Altcoin is currently looking for the next significant resistance level. It has moved past $8. With the increase in buying power on the chart, technical perspectives for the coin have turned more positive.
In the last 24hrs, the coin saw a 2% increase in chart position. LINK also experienced a 14.7% appreciation over the previous week. Although Chainlink’s price has managed to re-enter the $8.80 level, it still faces stiff resistance.
Chainlink needs to rise above the $8.80 price ceiling in order for its buying strength to continue to be high. If LINK crosses the $8.80 price threshold, it may target $9. This would invalidate the bearish thesis. A small drop in altcoin demand can help to bring the bears back.
The Four-Hour Chainlink Price Analyse Chart

LINK had a price of $8.72 at time this article was written. Shortly after hitting the $8.80 price level, the altcoin experienced a retracement. The immediate price ceiling for LINK stood at $8.80 and a push above that level will propel Chainlink’s price to $10.
The local support level was set at $8.16 for LINK. Any fall below that would bring the price to $7.60. In the last session, Chainlink was traded at a higher level. This indicates that there was bullish pressure in the market. The buying strength has increased over the past trading sessions.
Technical Analysis

Trading on the altcoin is characterized as being positive and in line with an ascending trendline. The Chainlink price reached higher highs than lows, signifying positive price movement.
If LINK doesn’t break past the immediate resistance mark, the coin can lose its current price momentum.
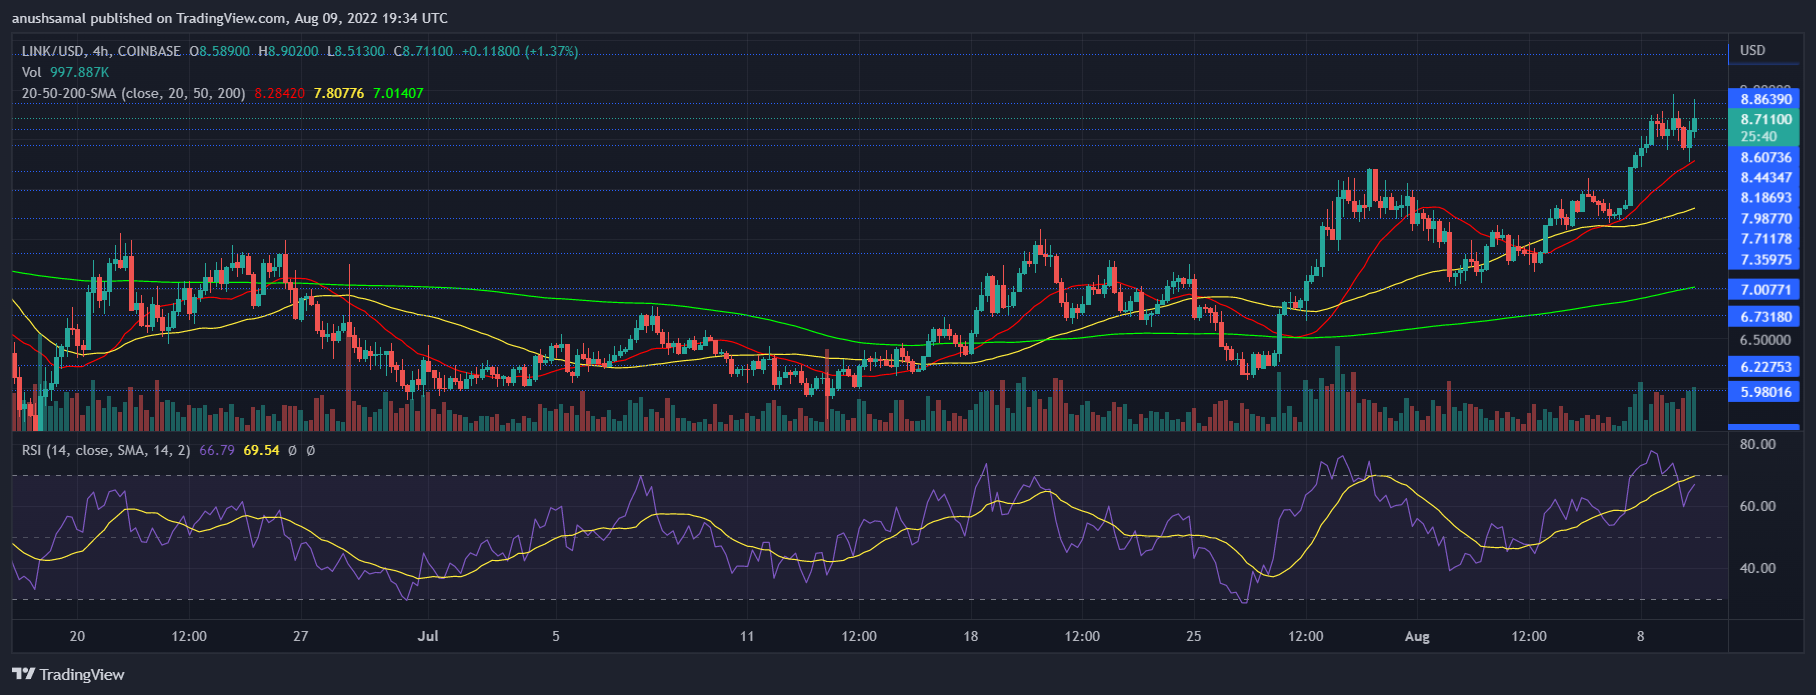
After visiting the overbought area, altcoin briefly travelled south. Relative Strength Index rose above 60, indicating increased buying power.
The price of Chainlink was higher than the 20-SMA level. The market was experiencing price momentum when the reading is above the 20 SMA line.

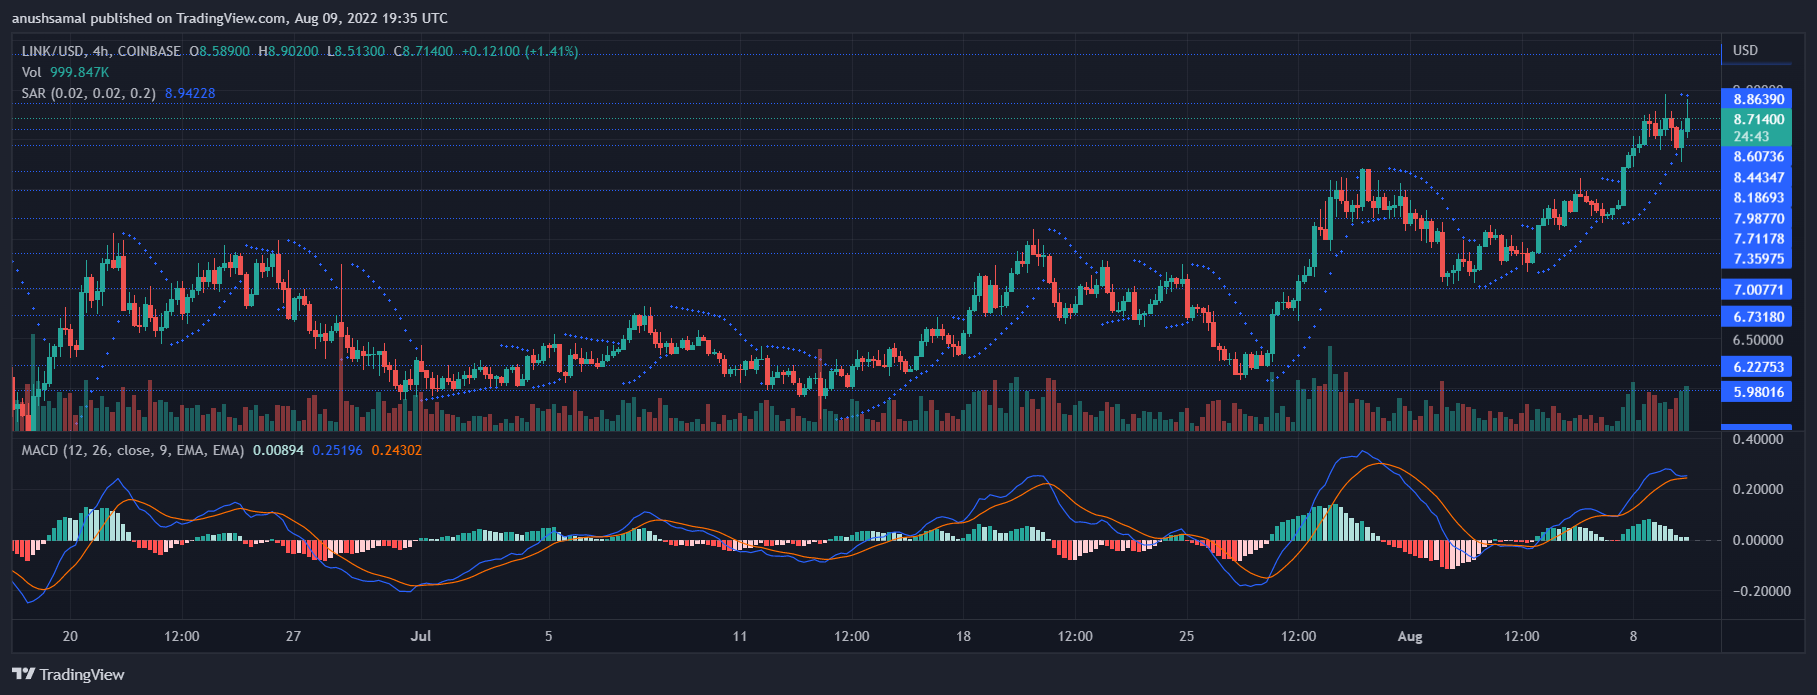
LINK shows a stronger buy signal in the 4-hour chart. The increase in demand was also captured by indicators. The current price momentum is represented by Moving Average Convergence Divergence. It also shows possible reversals. MACD experienced a bullish crossover, and the indicator displayed green signals bars.
These signals are selling signals for the Coin. Chainlink’s price may soon rise to $8.80, if the buyers keep acting on this signal. Parabolic SAR depicts the trend, the indicator, however, hasn’t painted a positive picture. In anticipation of a drop in prices over the next trading session, it formed a dotted area above the candlestick.
Featured Image from Yahoo Finance. Chart from TradingView.com