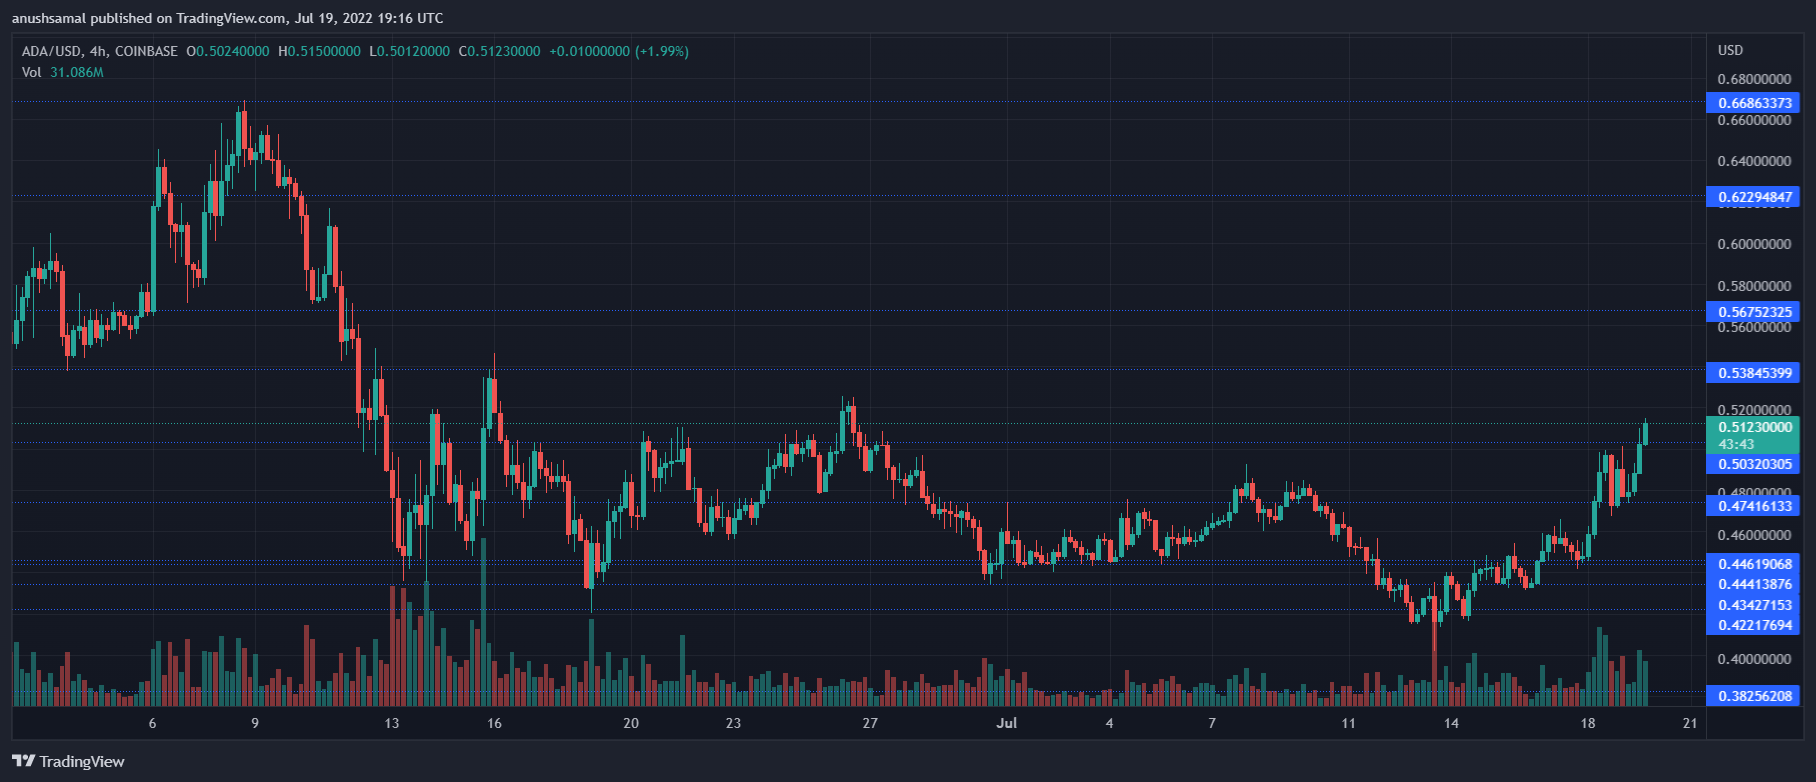
Cardano’s bullish trend has continued and the stock managed to break through crucial resistance. ADA has risen by nearly 20% in the past week. Over the past 24 hours, altcoin has moved up along an ascending trendline. The $0.47 support line is holding the altcoin steady.
The bulls have returned after Cardano finally reclaimed its resistance level. ADA must remain above the resistance level it has crossed to maintain bullish momentum. It’s too soon to tell if ADA is in a bullish trend or if it’s a relief rally.
Bitcoin’s upward movement and moving above the $22,000 level has pushed other altcoins on a bullish price action. The bulls have been strengthened by buyers returning to the market.
Broader market sentiments could again bring ADA down to its current support level. Global cryptocurrency market cap is currently $1.11 Trillion. 5.4% change in the last 24 hours.
Cardano Price Analysis: Four Hour Chart

At the time this article was written, ADA traded at $0.506 It broke the $0.50 mark, which the coin struggled to break past in the past few weeks. Although the coin had $0.53 overhead resistance, a little loss of momentum could bring it down to $0.47.
Cardano needs to stay above $0.50 in the next trading session for bears to be subdued. ADA must maintain a high level of buying strength in order to sail north. Cardano volume traded was high, which suggests an increase in buying power on the chart.
Technical Analysis

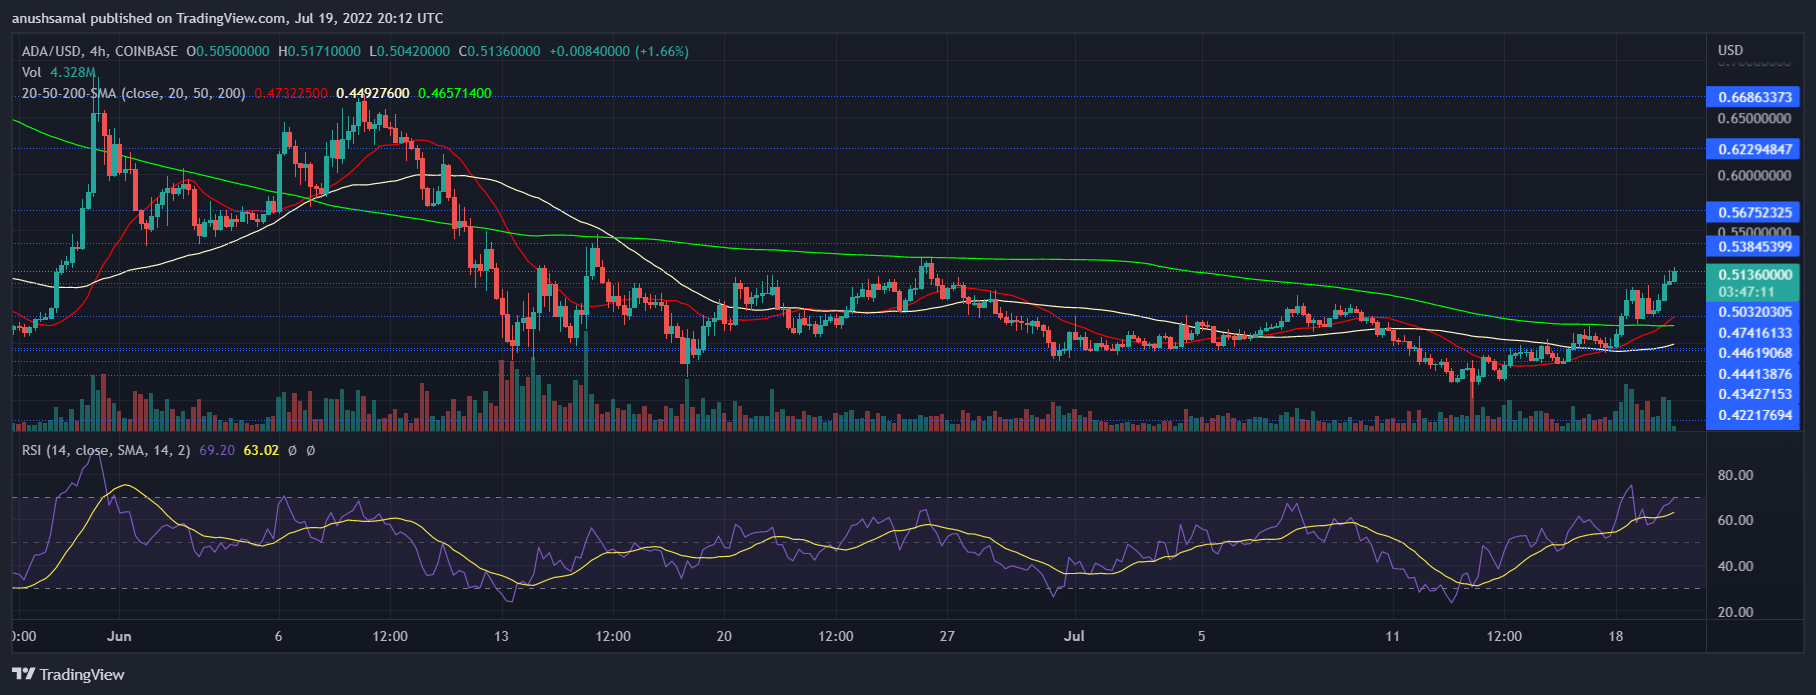
ADA demonstrated buying strength in the 4 hour chart. Cardano could rally further if buyers are at the helm. According to the same, Relative Strength Index was higher than 60 point which indicates that buyers outnumbered sellers.
The price of ADA was higher than the 20-SMA, which indicates that buyers are driving market momentum. Cardano’s price was also higher than the 50-SMA, 200-SMA lines which indicated bullishness.
Why Cardano (ADA) Is Likely To Rise as High As $0.60 By End Of 2022, Experts Predict| Why Cardano (ADA) Is Likely To Rise as High As $0.60 By End Of 2022, Experts Predict

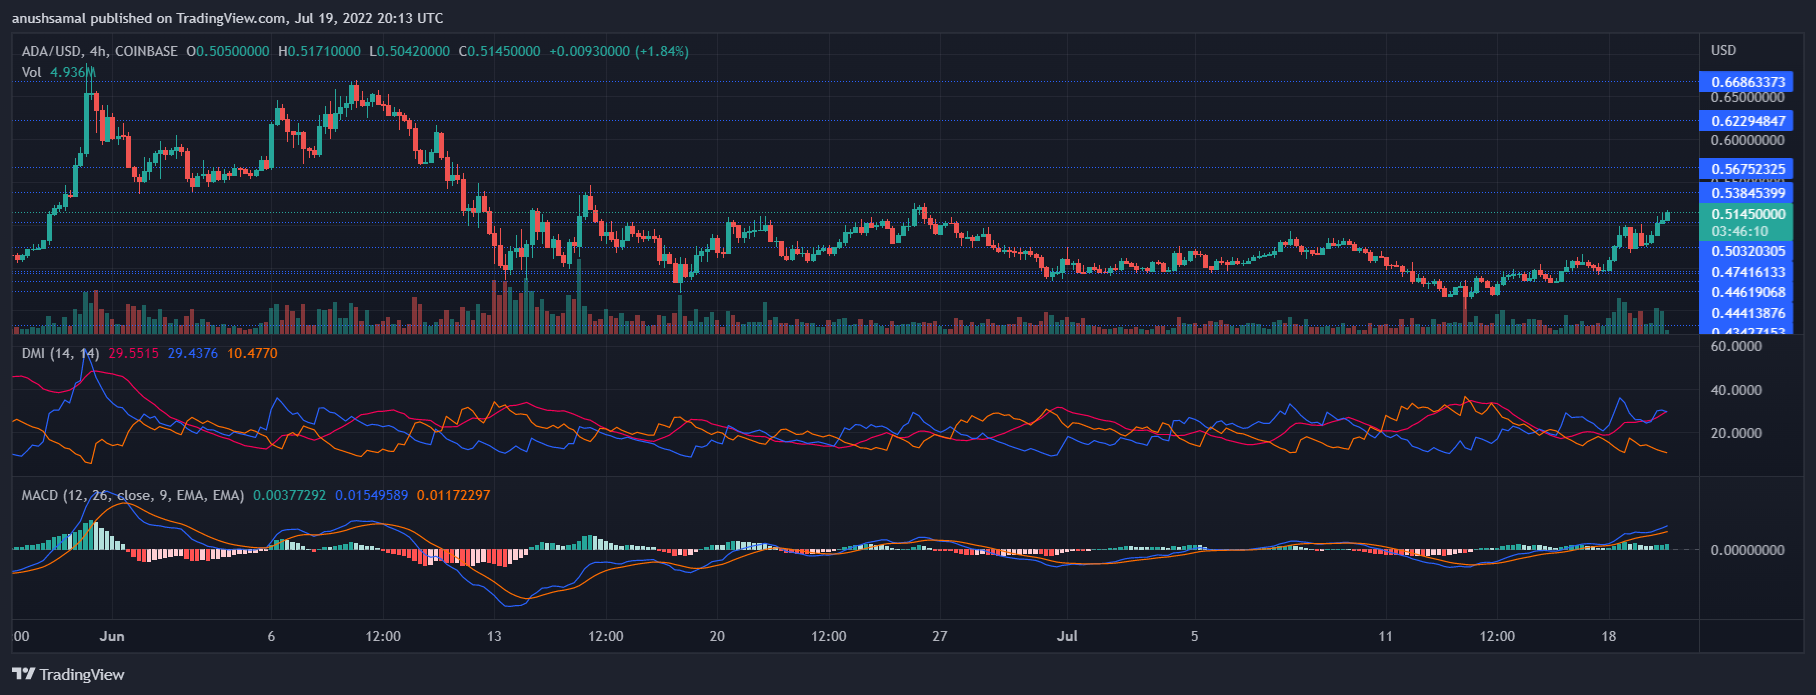
Cardano’s upward trend was reflected in other indicators. This indicator shows price momentum, trend reversals and Moving Average Convergence divergence.
MACD was subject to a bullish crossover, and the histograms were painted green. This is considered a buy signal.
Directional Movement Index is used to determine which direction the coin is heading. As the +DI crossed above the line, DMI was positive.
Average Directional Index Red (Red) is close to 40, which means the trend towards upwards is stronger. To ensure that ADA continues to rise, buyers must be available along with the push of the wider market.
Related Reading: Ethereum pushes above vital resistance, could soon revisit $1500| Ethereum Pushes Above Vital Resistance, Could Soon Revisit $1500
Featured Image from UnSplash. Chart by TradingView.com