
Bitcoin’s price is trading in a sideways fashion, unable to overcome its immediate resistance level. Bitcoin has fallen by 1% in the past 24 hours. This confirms sideways trading. BTC has made very little progress over the past week.
The coin could see a rapid fall if it keeps at the same price. According to technical analysis, there is a weakness in buyer power. As the currency fails to rise north, the demand for it remains low.
The Bitcoin price could fall below this level, which would even mean that it will drop to $18,000. The price of $18,900 is a solid support level for bitcoin at this time. The $18,000 support level will be reached by the coin. If that happens, $17,400 will become the next level.
The asset’s price can be dragged up to $16,000 if it experiences depreciation below $17,000. While a push beyond the $20,000 level could render the bears ineffective for a while, demand for Bitcoin must rise over the next trading session.
One-Day Chart: Bitcoin Price Analysis
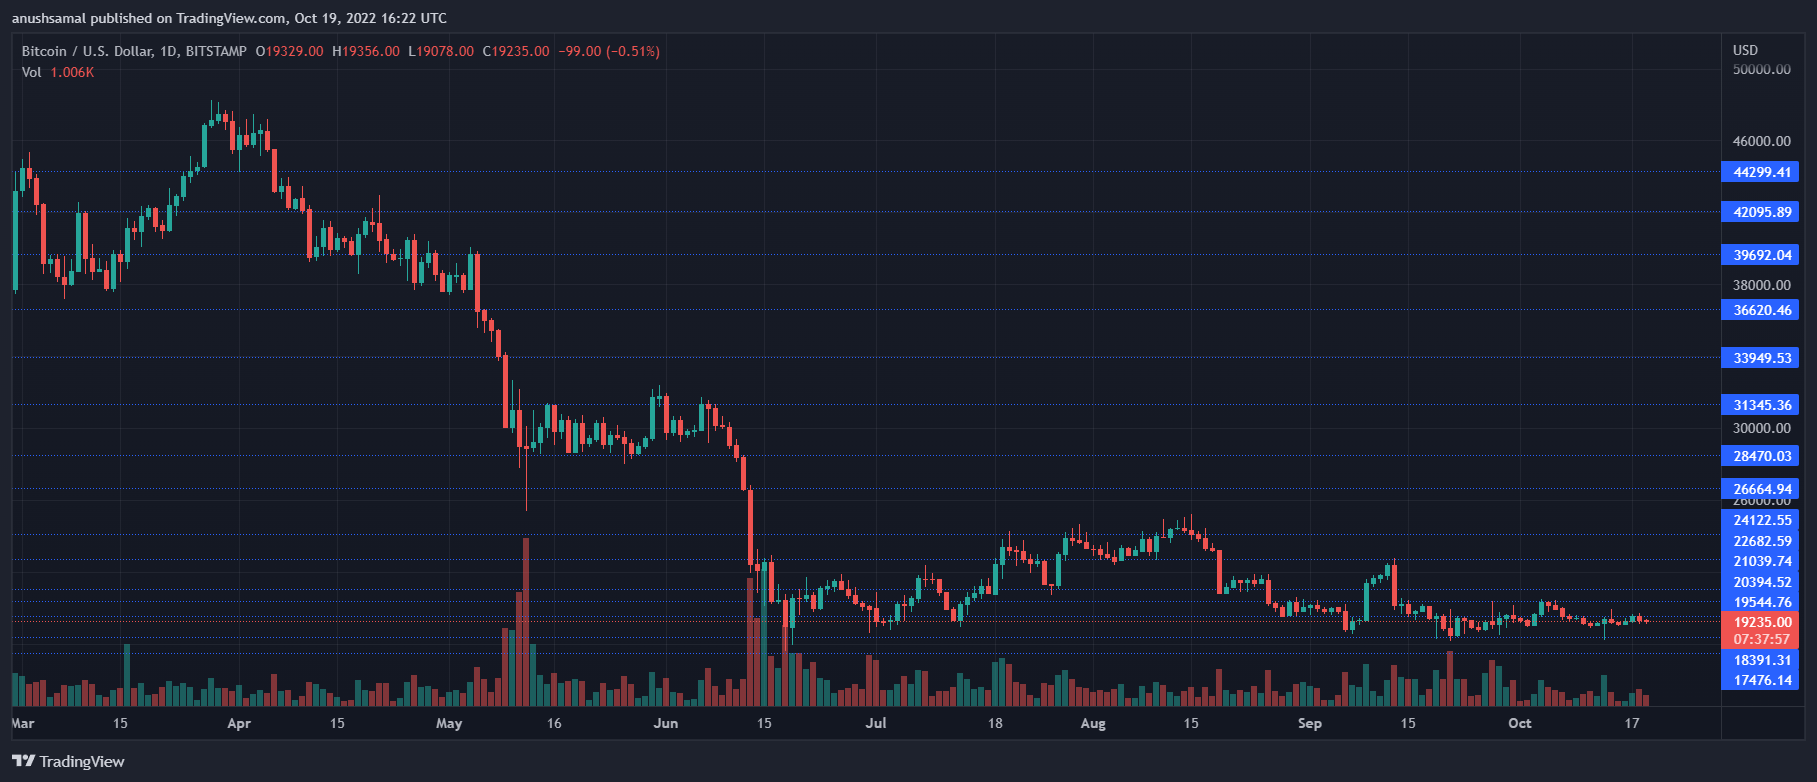
BTC traded at $19 200 at the time this article was written. In the previous trading sessions, the coin was rejected at $19 600.
BTC’s immediate resistance level is $19 400. Any move higher than that could see it reach $19 600. BTC needs to rise above the $20,000 level in order to be taken seriously by bulls.
On the flip side, the coin’s support line was at $18,900. If bears continue to control the coin, $18,000 would be the next stop. A further drop of $18,000 will take the coin down to $17.400. Then it will be at $16,000.
Bitcoin trading volume in the most recent session decreased, which suggests a fall in buying power as of the writing.
Technical Analysis
The coin’s demand has decreased as a result of the consolidation. Technical indicators showed that the bears were still dominant. BTC buyers could be helped by a move up to the next resistance.
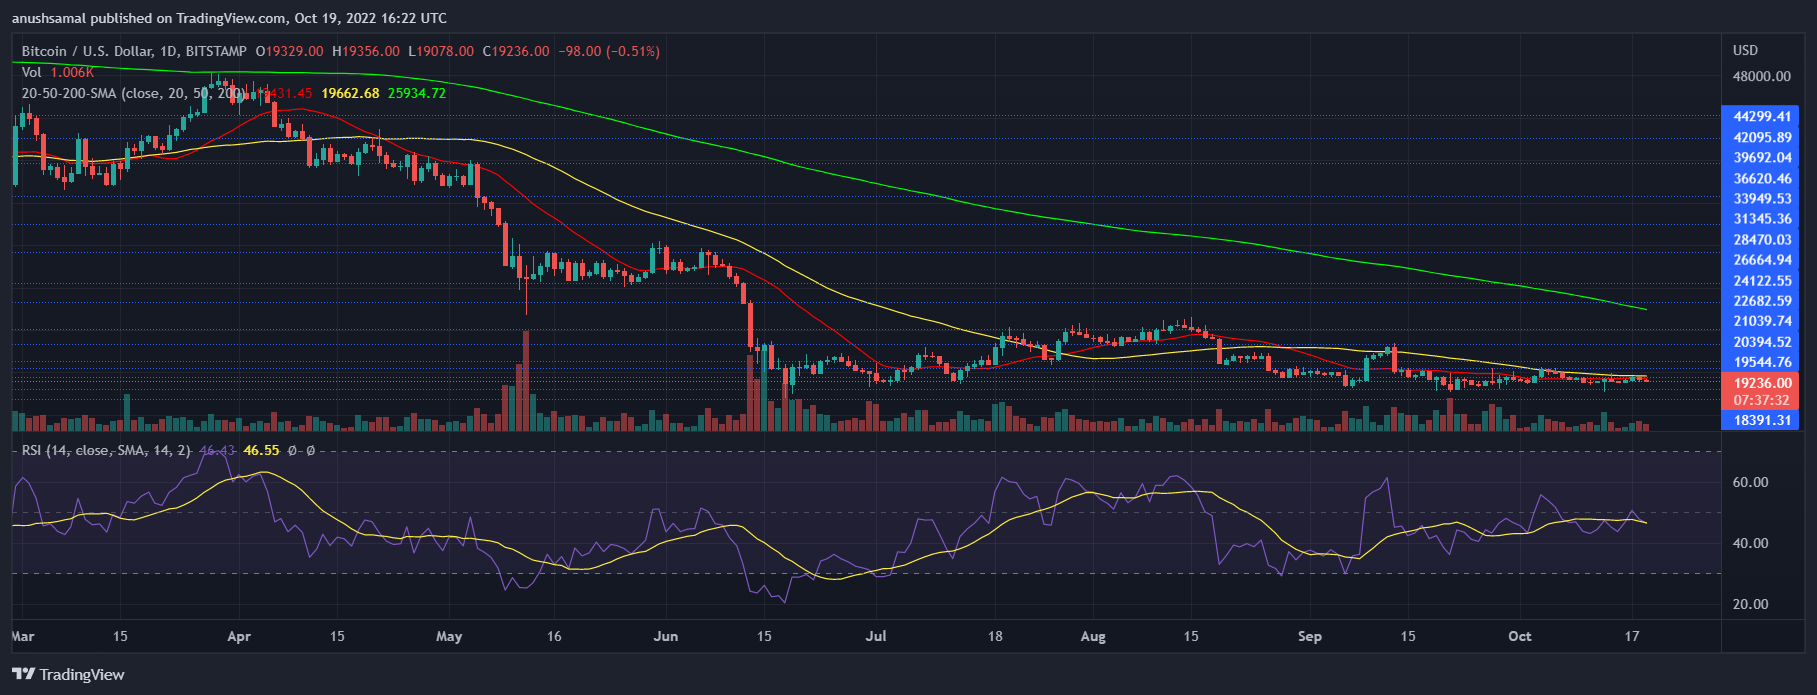
Relative Strength Index was lower than the half-line. This meant that sellers and buyers were less common.
Bitcoin prices were below the 20 SMA, meaning that the demand was low and sellers are driving price momentum.
All other indicators pointed to bearish strength. The coin’s buy signal was however given by the one-day charts.
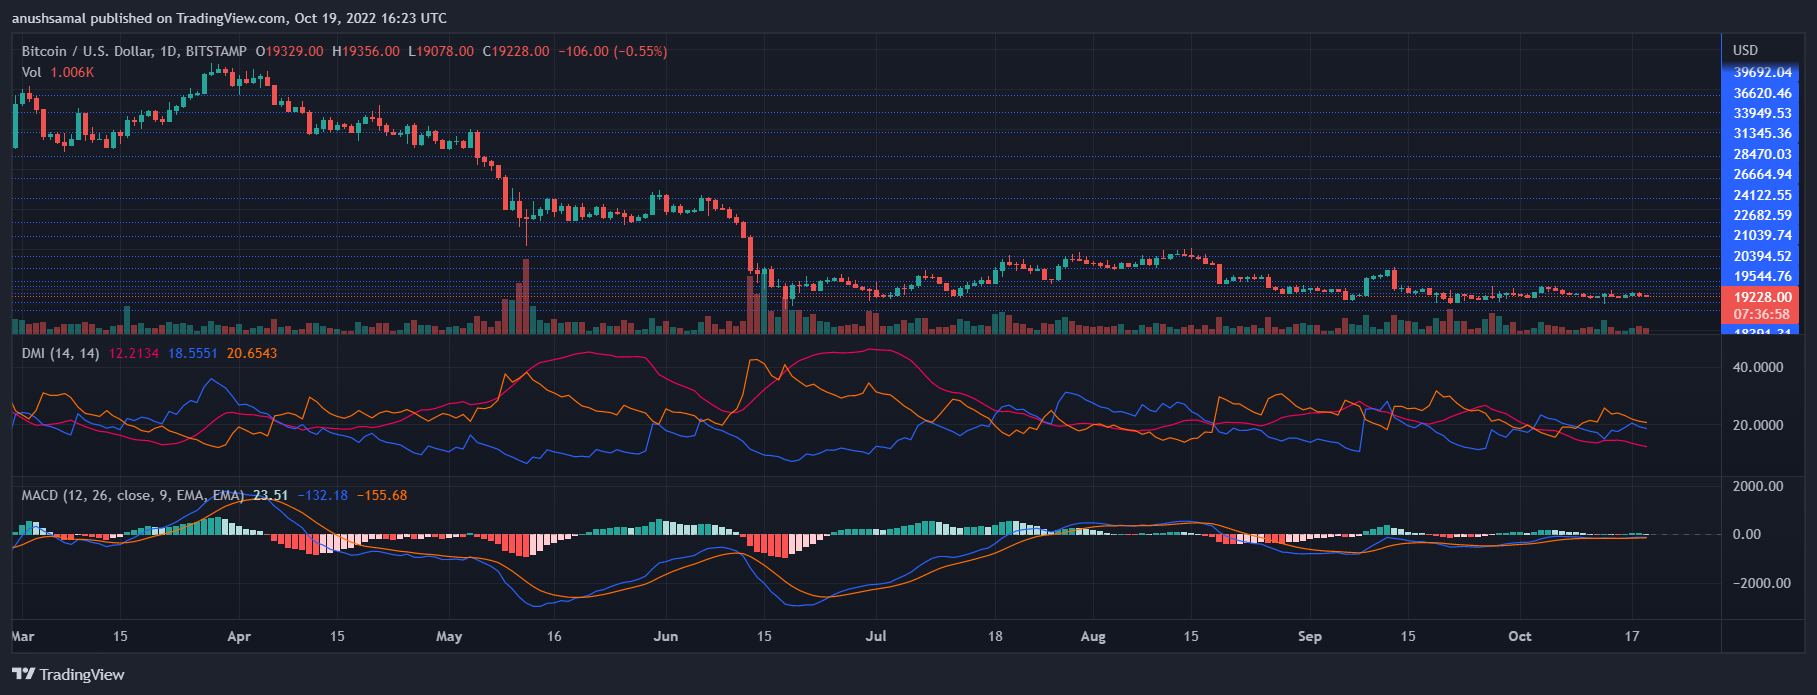
Moving Average Convergence Divergence tracks the asset’s price momentum.
Green signal bars continued to appear on the MACD, which is a buy signal. This might indicate that BTC could see upward movement.
Directional Movement Index measures the strength and price direction of an asset. The DMI (Decreased Movement Index) showed that the -DI (orange), was higher than the +DI (blue).
Below the 20 mark, the Average Directional Index was red. This indicates weakness in current price movements.