
Bitcoin NUPL data suggests that the crypto’s cycles are getting less sharper with time as profit tops and loss bottoms aren’t following a horizontal line.
Bitcoin NUPL Didn’t Exceed The 0.75 “Greed” Mark During This Cycle
As explained by an analyst in a CryptoQuant post, the BTC profit and loss cycles shouldn’t be treated with horizontal lines.
The “Net Unrealized Profit and Loss” (or the NUPL in brief) is an indicator that tells us whether the market as a whole is holding a net profit or a net loss right now.
The metric’s value is calculated by taking the difference between the market cap and the realized cap, and dividing it by the market cap.
NUPL = (Market Cap – Realized Cap) ÷ Market Cap
This indicator indicates an average investor currently has profits if it is larger than 0.
Conversely, negative NUPL numbers indicate that there is an unrealized amount in the market at this time.
Here’s a chart showing the evolution of Bitcoin NUPL throughout the history of crypto.
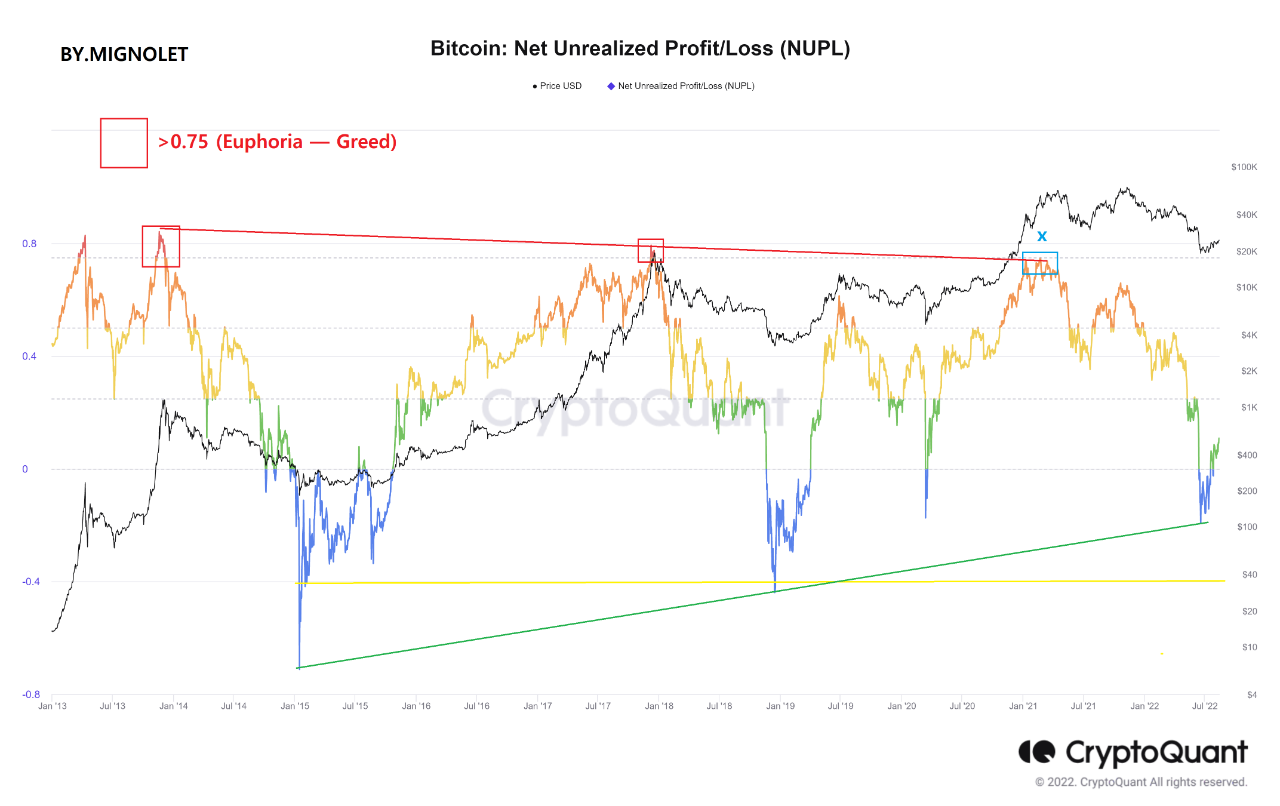
The value of this metric seems to have jumped up recently and has turned positive again. Source: CryptoQuant| Source: CryptoQuant
You can see that the graph shows the areas of interest for the Bitcoin NuPL indicator.
In the past, many traders used to believe that cycle tops form whenever the metric’s value surges above 0.75, entering into the “greed” zone.
Similarly, bottoms were thought to take place when the indicator went below the -0.4 mark, reaching into the “fear” region.
However, the analyst from the post argues that horizontal lines like these shouldn’t be used to mark these cycle tops and bottoms.
The top reached after the first cycle was less than that of the second. This cycle the top of the metric did not reach the greed zone. It topped just below the 0.75 mark. It could be that the tops of the metric are dropping with every cycle.
Similar to the previous bottoms, both had decreasing loss amounts. Just a while ago, the NUPL’s value sharply dropped off into negative and subsequently rebounded back up into positive values after forming a potential bottom. But this was far below the traditional 0.4 mark.
This low would be the lowest point in this cycle. It would also support the notion that market fluctuations are becoming less dramatic with the passage of time.
BTC Prices
At the time of writing, Bitcoin’s price floats around $24.4k, up 5% in the past week.

Cryptocurrency's value seems to be moving in a sideways direction recently. Source: TradingView, BTCUSD| Source: BTCUSD on TradingView
Featured image by Kanchanara at Unsplash.com. Charts from TradingView.com and CryptoQuant.com.