Ethereum suffered losses just like the other altcoins. In the 24 hour period, Ethereum fell below the $1900 level. Bitcoin and the major industry altcoins also dropped on their charts. Over the last week and half, most coins have been consolidating their charts.
Some altcoins were able to gain momentum after the consolidation. However, the bears quickly reacted to the market’s choppiness and stopped them from climbing on their charts. The market continues to be weak and overhead resistance is still strong for Ethereum.
ETH has seen price volatility, so buyers are still unsure of what their next move will be. Ethereum captured a bullish signal in spite of bearish price action. The coin may regain its bullish position if demand increases in the coming trading sessions.
Ethereum Price Analysis: 1 Day Chart

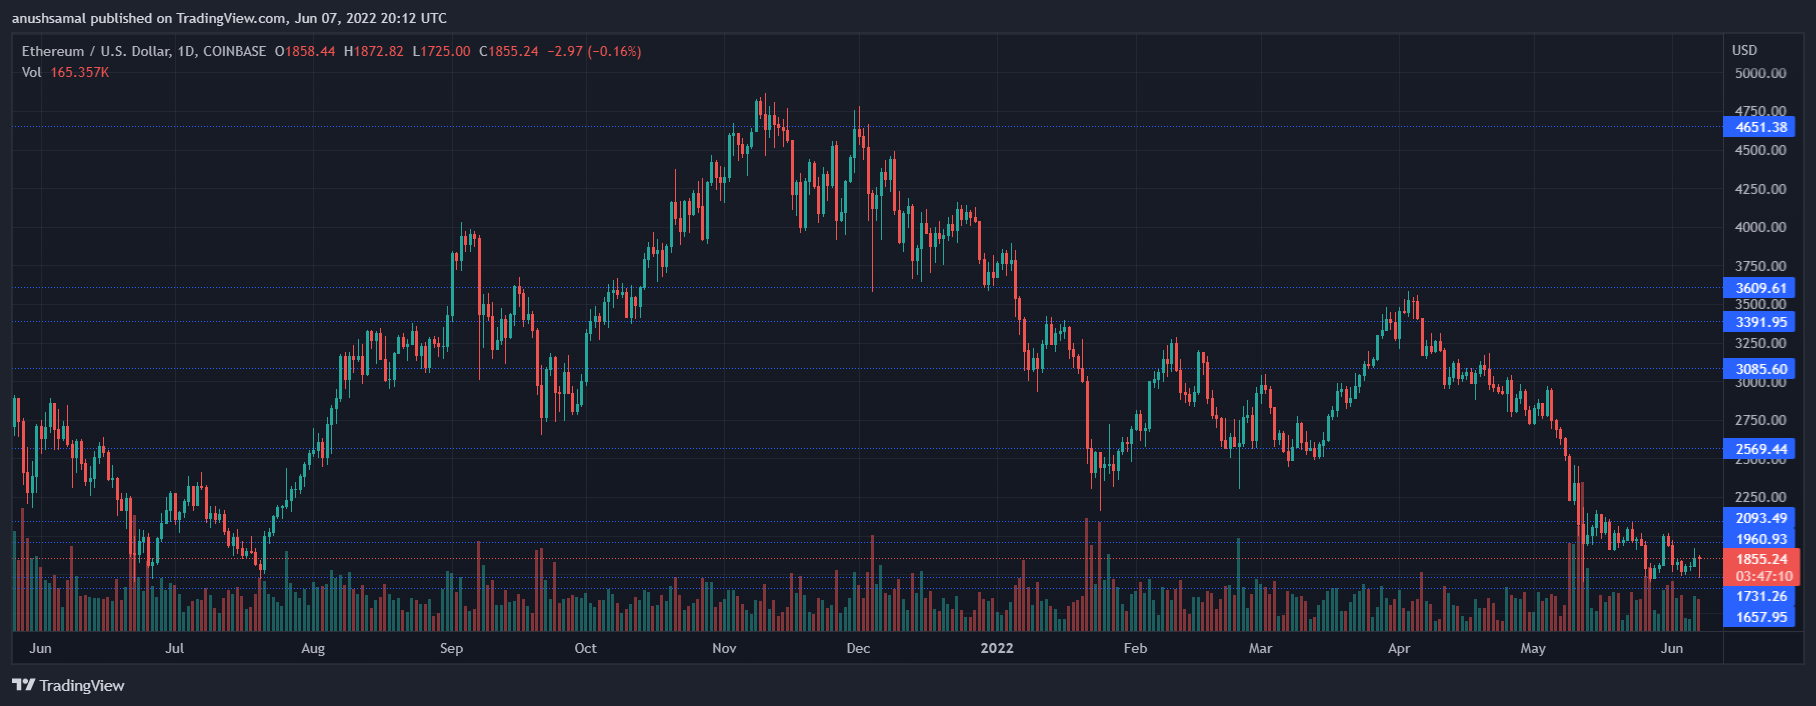
After it faced stiff resistance at $1900, ETH exchanged hands at $1800. Ethereum has lost 2.6% in the past 24 hours. ETH lost almost 10% over the past week. ETH trading near $1700 will be possible if the price drops from current levels.
Ethereum returned to trading at the July 2021 price level. At $1960, the overhead resistance was anticipated for Ethereum. If the demand for altcoin is steady, it could trade at or near $2000.
While Ethereum’s volume declined slightly, its bar colour was bright red. A bearish price movement was indicated by the red bar.
Technical Analysis

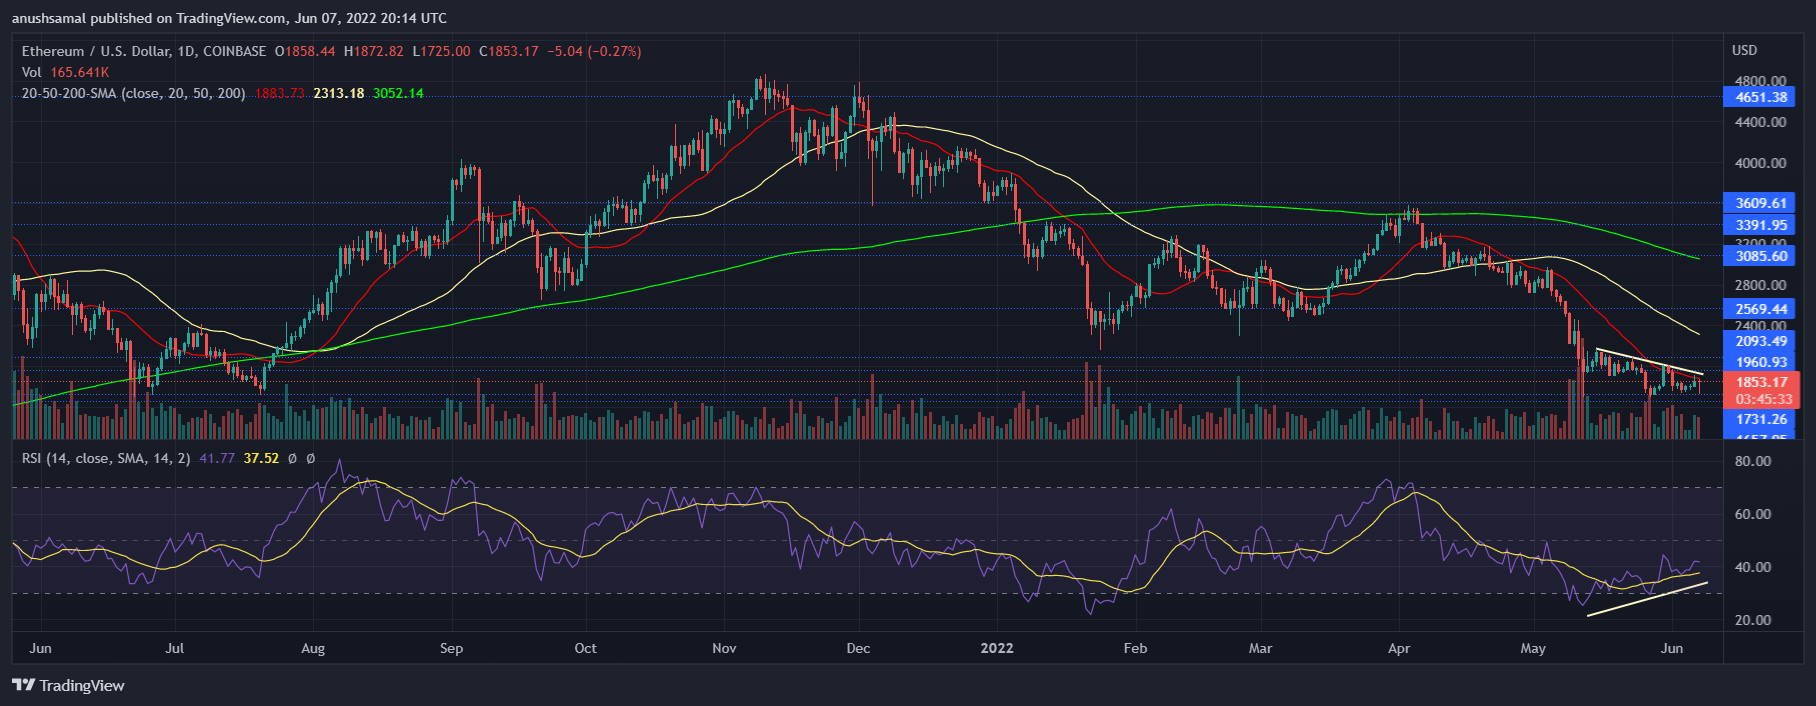
Even though the altcoin’s price fell, it saw a significant increase in buyers. This indicates optimism for the coin’s future trading sessions. Relative Strength Index showed a bullish divergence, Yellow.
It occurs when, even though the price falls, there is an increase in market buying power. This indicates a bullish trend. Although the RSI was heading towards the 50% mark, sellers still outnumbered buyers at press time.
The same reading indicated that Ethereum was trying hard to surpass the 20-SMA. It can push buyers into driving the market’s price momentum if the buying power is maintained.
TA: Ethereum Fails Near Key Resistance, Why $1,700 Is The Key| TA: Ethereum Fails Near Key Resistance, Why $1,700 Is The Key

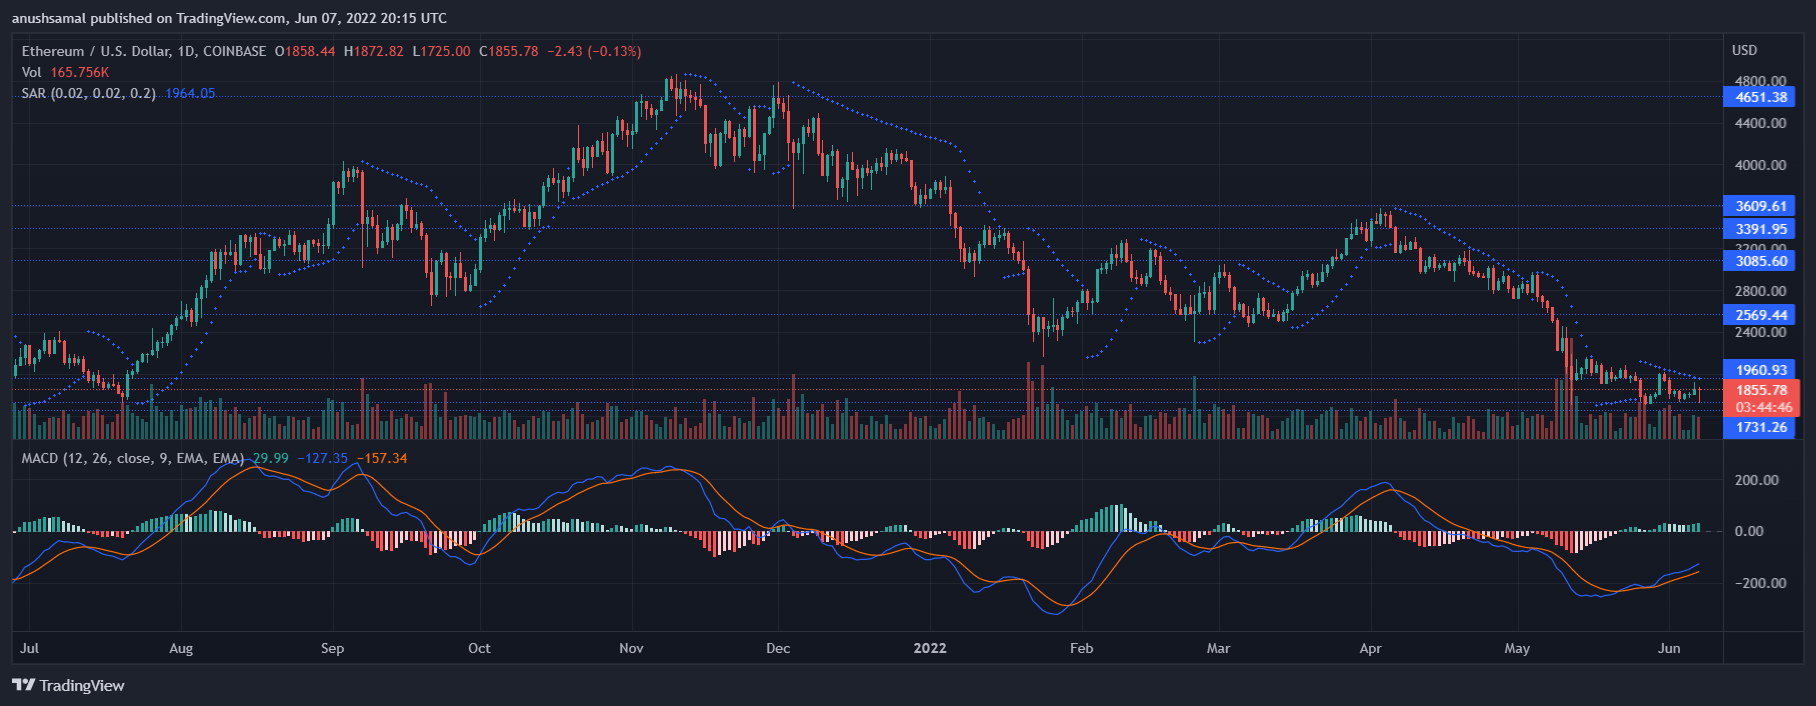
The altcoin continued to display that the bulls still haven’t completely faded. Moving Average Convergence Divergence (MACD) is used to measure price momentum as well as changes within the same. MACD displayed green signals bars after a bullish crossover.
Green signal bars indicate a buy signal. Buyers can drive Ethereum’s price up to $2000 if there is demand. However, the Parabolic SAR showed a trend reverse as the dotted line moved higher than the candlesticks. This is in line with market bearishness.
Parabolic SAR, however, can not be relied upon to determine trend changes.
Glassnode: Bitcoin Long-Term Holders Own 90% Of Supply In Profit| Glassnode: Bitcoin Long-Term Holders Own 90% Of Supply In Profit