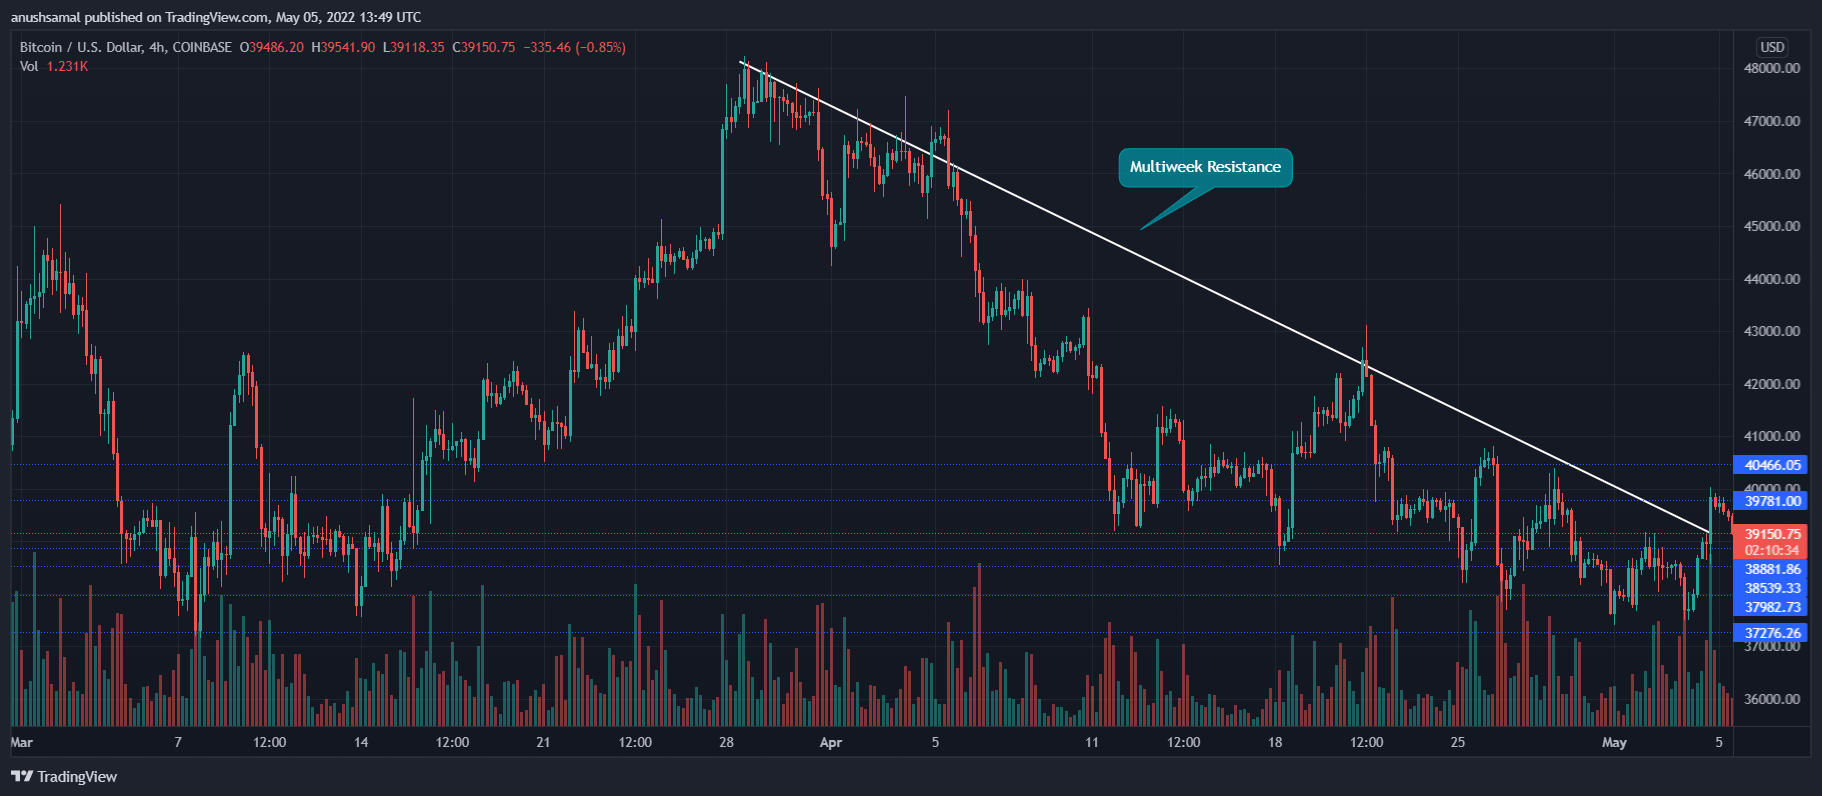
Bitcoin saw a 2% increase in its value over the 24 hour period. After reaching the $37,000 level, the price of Bitcoin saw some relief. As broader markets started to recover Bitcoin’s price action moved on a north-bound journey.
Currently, Bitcoin’s prices were trading in a tightly consolidated region because the coin did not manage to go past the $39,800 price mark. The market is still too young to know whether the bulls will resurface completely.
If demand doesn’t recover considerably, then the digital asset could fall back to the $38,000 price level, which is acting as a support level for the coin. This is a good sign, as Bitcoin managed to surpass its resistance line for several weeks.
Bitcoin may reclaim the $40,000 level if bulls maintain their pressure. Bitcoin traders must stay on the market in order to trade to the upside.
The Four Hour Chart: Bitcoin Price Analysis

Bitcoin’s price was $39,100 as of the writing. The price of Bitcoin fell again from $39,800 after breaking through the resistance for several weeks.
This indicated a brief correction because the coin’s prices plunged at the time of writing. This was the immediate resistance of the coin at $40,000.
Bitcoin may reach the $44,000 level if Bitcoin breaks that price threshold. The support level was set at $37900, and Bitcoin will trade close to $37,000 if it falls below that.
Trading volume for the coin has yet to gain momentum as the last trading bar in red indicated that there was negative price movement.
Technical Analysis

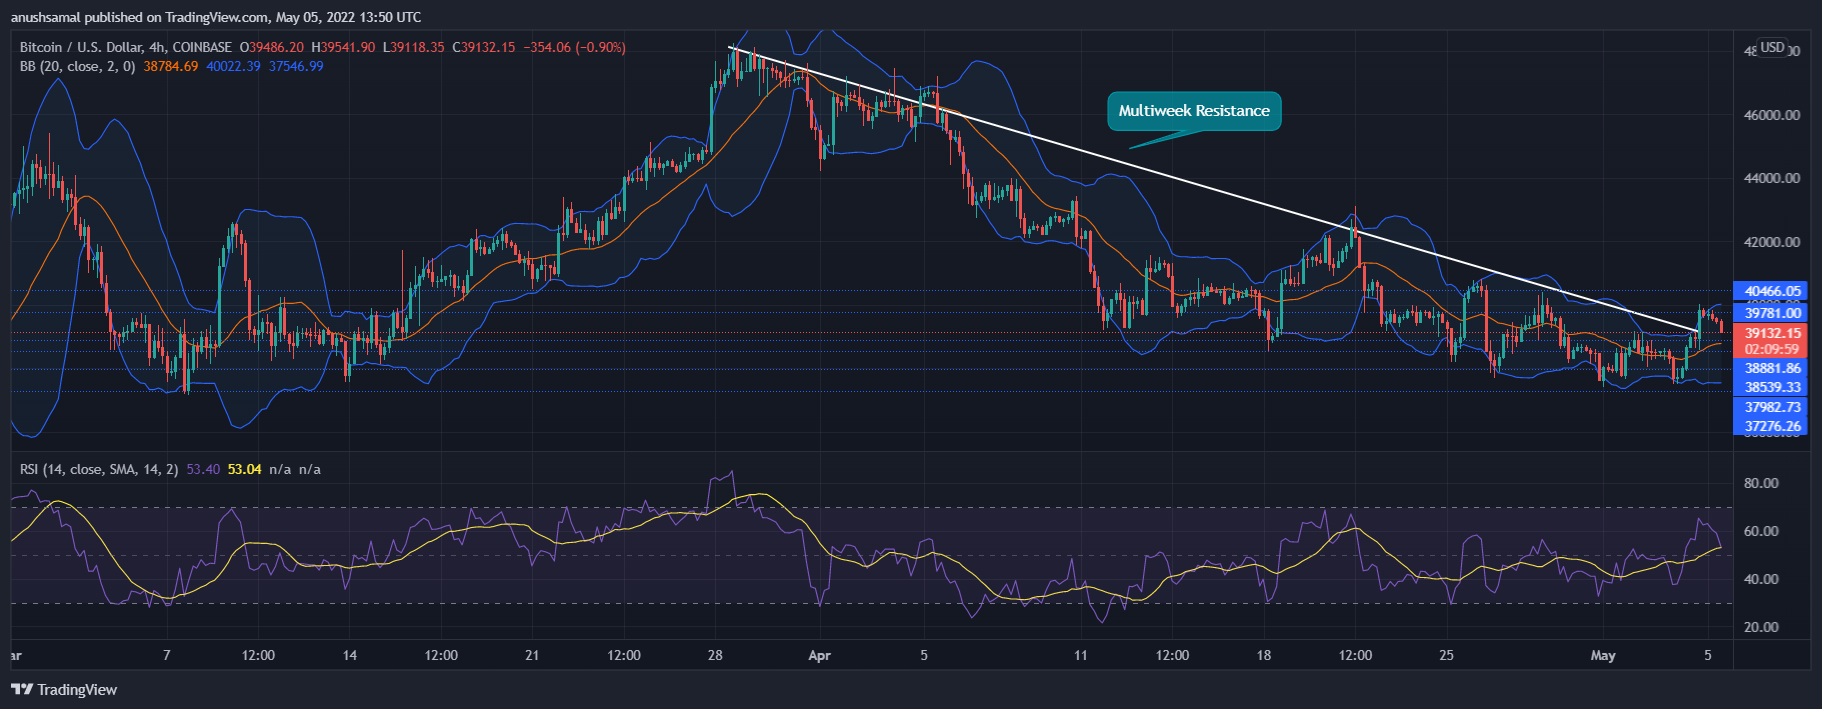
The buying power fell significantly after the break of the multiweek resistance. At press time, the currency plunged after a significant rise on the chart. Gains weren’t substantial and that had pushed the coin down further.
Relative Strength Index close to 50 was observed, signifying a decrease in buyers’ strength due to market exits. 27 was the fear index, which indicates that there is a lot of fear.
Bollinger Bands are indicators of volatility in markets. The indicator has expanded since the time this article was written. A widening of the bands means that there will be an expected increase in volatility during the trading sessions.
Bitcoin Long Squeeze Incoming?| Bitcoin Long Squeeze Incoming? The Funding Rates Rise

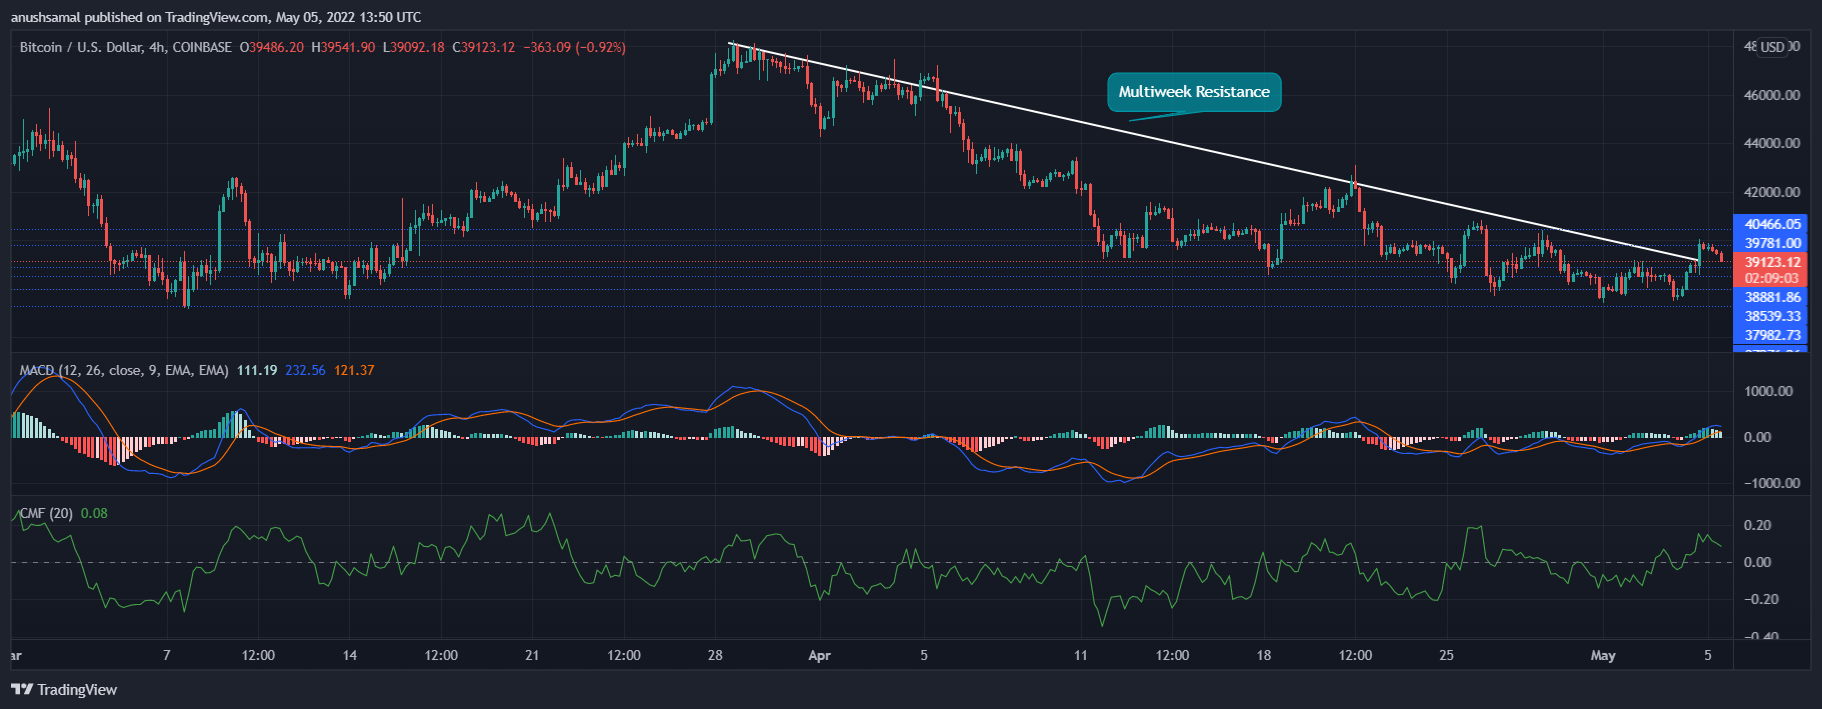
MACD, which is used to indicate market momentum, indicates bullish momentum. However, at press time the histograms appeared to be fading which indicated continued bearish price actions for the coin.
Chaikin money flow was positive on capital inflows as it was over the half line. However, there was a slight downtick in indicator which could have been interpreted as an indication of increased capital outflows.
Similar Reading: One coin, two trades: Why Bitcoin futures and spot signals don’t match up| One Coin, Two Trades: Why Bitcoin Futures And Spot Signals Don’t Match Up
Featured Image from UnSplash. Chart by TradingView.com