Solana Price has made an attempt to reach the $44 price mark once again. It is only a matter of when the coin will make its next move. The coin has seen a 14% increase over the week, and a close-to 3% rise in its market value in the past day.
Over the past 24 hour, SOL has seen steady gains. The market is currently dominated by bullish forces. This could lead to a higher price for SOL if there’s continued demand. The technical outlook of the coin remains positive as at this writing.
In the past, the Solana prices had never exceeded $44 per unit. SOL needs steady demand to break through that mark. It would be near the bottom of its support zone, if the price falls to $44 below. Today, the global cryptocurrency market was worth $1.21 Trillion. Increase of 0.6% in the last 24 hours.
Solana Price Analysis: Four Hour Chart
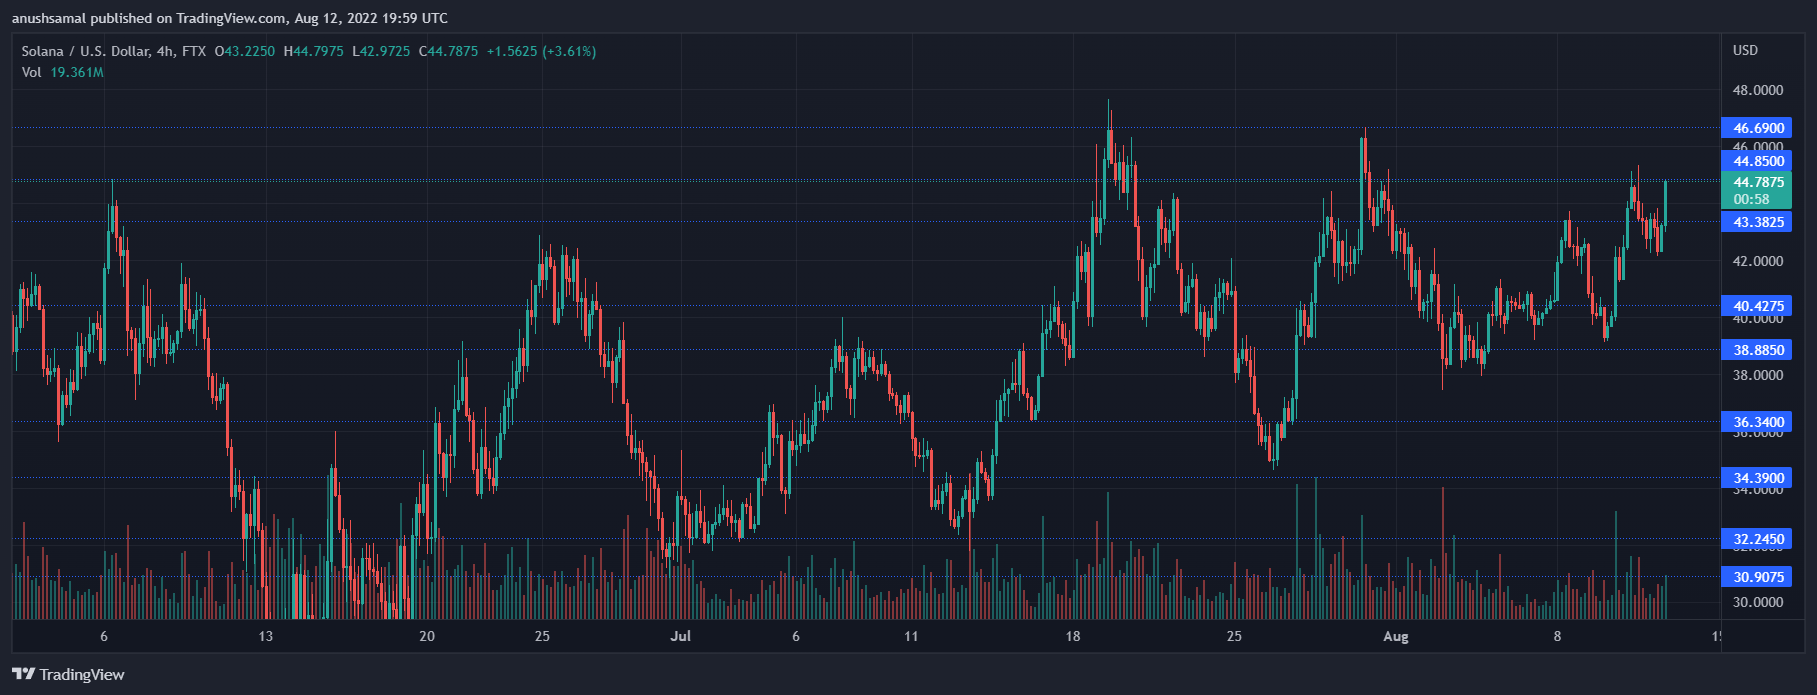
At the time this article was written, SOL was at $44.79. Bulls attempted to break the $44.79 price barrier again after multiple failed attempts. The coin’s overhead resistance was $46, but the bulls will have to move past $44 in order to break the price barrier. This is despite the fact that the bulls had failed twice before.
Solana was supported locally by $40. If the bulls manage to cross the $46 price level then it could touch the $50 price level. Increased buying power is evident by the increase in SOL trades during the session.
Technical Analysis
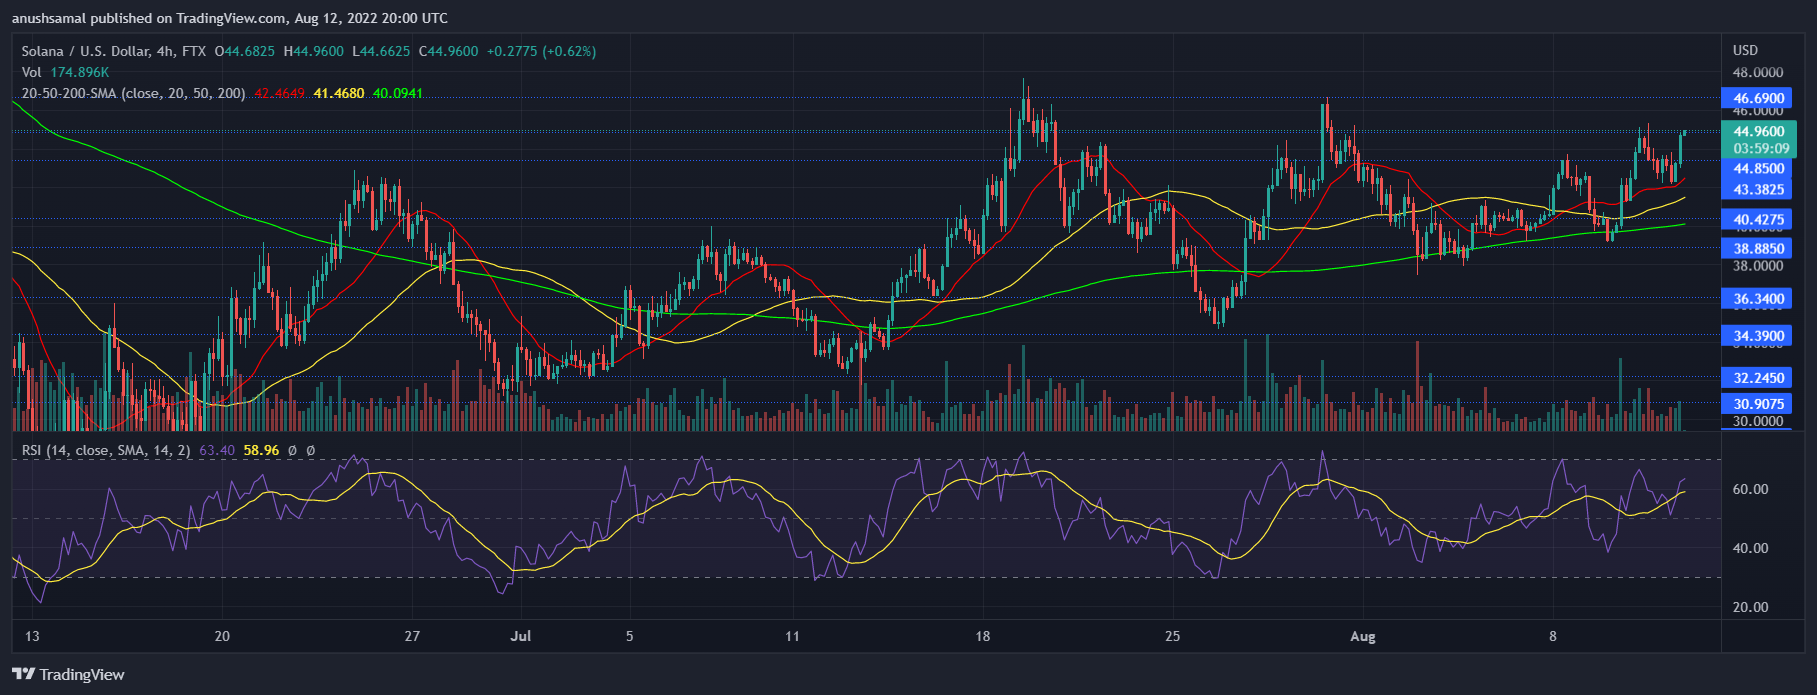
SOL’s technical outlook reflected bullishness on the four hour chart. When Solana prices moved higher, indicators showed the same sentiment.
Relative Strength Index was higher than 60 which means that there were more buyers than sellers as the demand for altcoin increased.
Solana prices were also higher than the 20 SMA lines, meaning buyers drove the price momentum. SOL was at or above the 200-SMA level, which signifies increased bullishness.
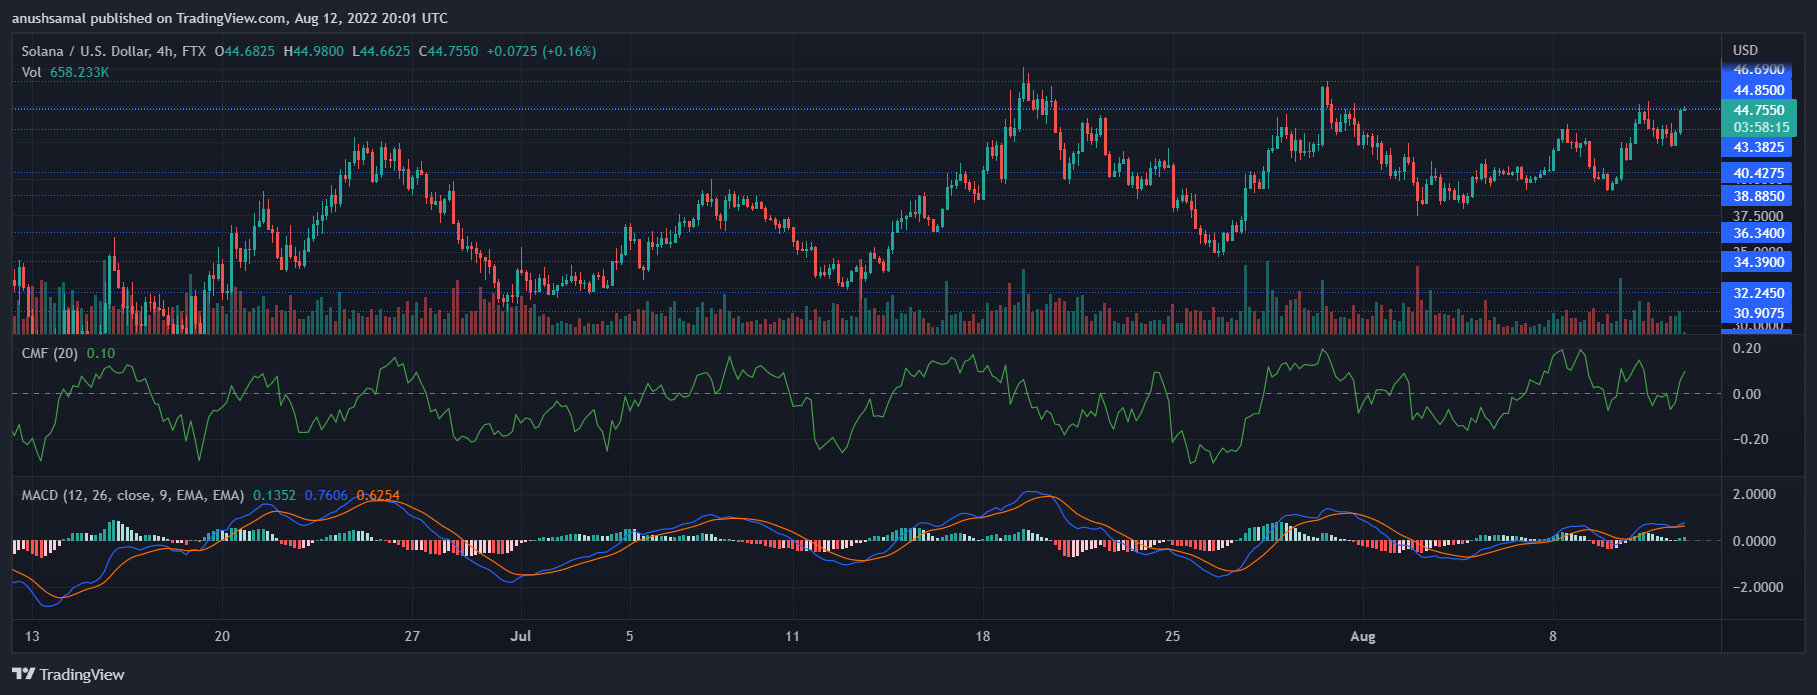
SOL’s past week was very beneficial for the coin. The bulls gained momentum over the past week which made it possible to push the price up to $44. This Moving Average Convergence divergence shows the price momentum as well as the reversals.
MACD went through a bullish crossover, and green signal bars were formed. These signal bars are in line with the increase demand and buy signals. Chaikin Money Flow indicates capital outflows and inflows. CMF crossed the line into a positive zone, which indicated increased capital inflows.