
The Bitcoin price plunged consistently following its breach of the $20,000 mark. The Bitcoin price has shown very little movement in the past 24 hours.
BTC’s value has fallen by close to 16% over the past week. BTC tried to quickly recover the $19,000 price mark from its chart.
However, the bulls couldn’t defend that price mark. The $18,000 support level was the closest to Bitcoin’s price. Over the last few months, Bitcoin has experienced a steady downtrend.
Technically, the coin favored increased bearishness.
On the daily chart, selling pressure outweighed buying power. Strong resistance will be provided by the $20,000 price point.
The Bitcoin price is at its lowest point of resistance, $20,000 The coin may temporarily experience some relief if there is an increase in its buying power.
Today, the global cryptocurrency market is valued at $962 billion. Positive 0.6%The last 24 hours have seen significant changes.
The One-Day Chart: Bitcoin Price Analysis
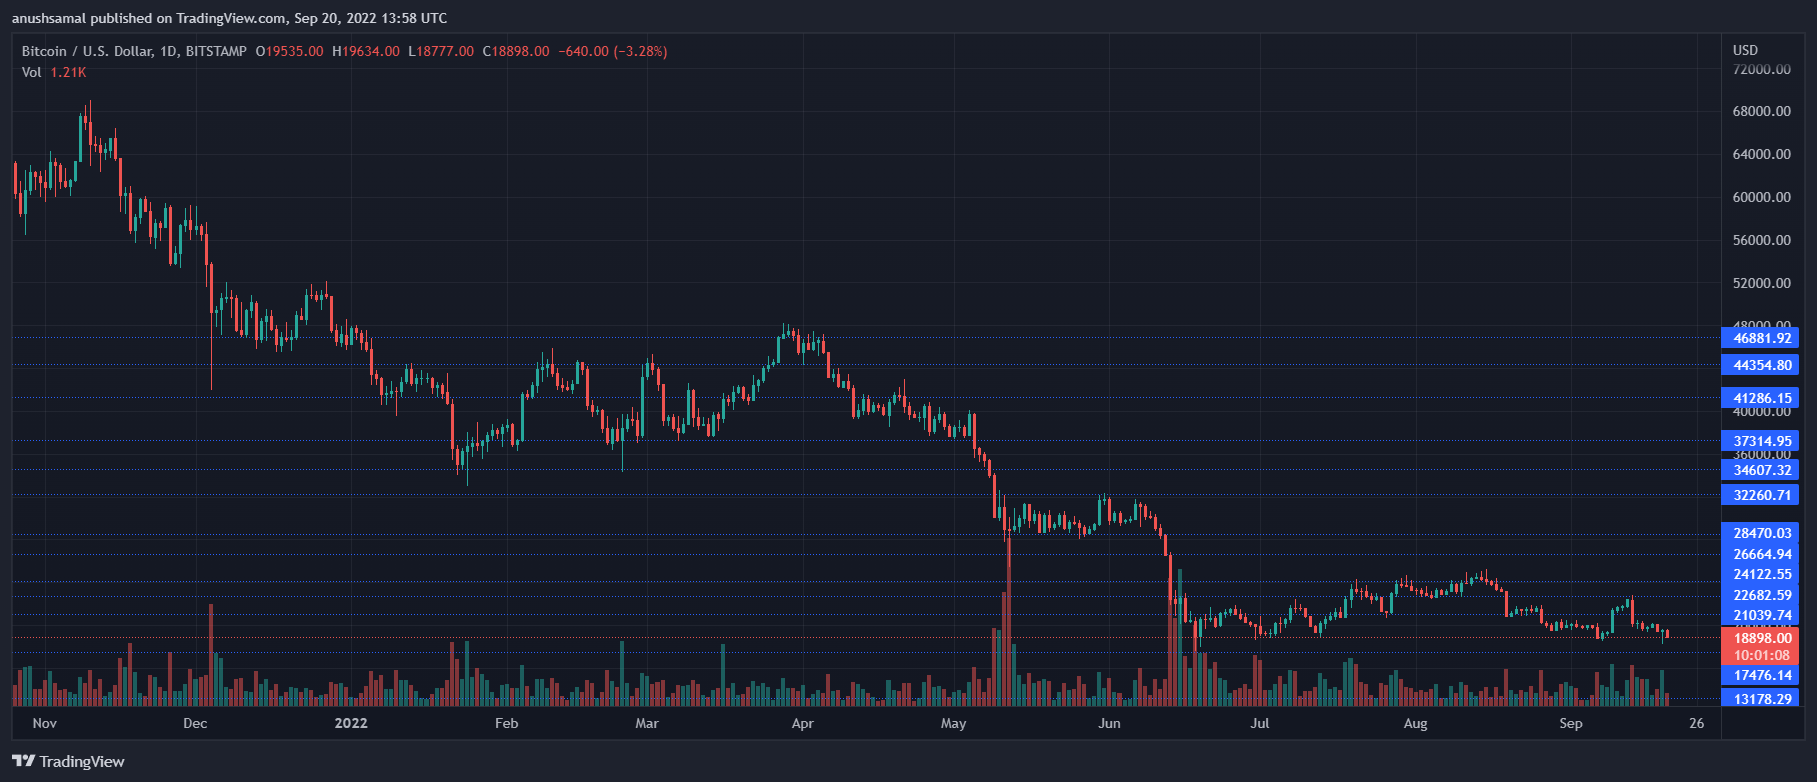
BTC trades at $18,800 as of the writing. Bitcoin traded above $19,000 just a few hours before. BTC was trading above the $19,000 price mark just a few hours before that. The overhead resistance of the coin stood at $20,000 and has been difficult to break through in the recent days.
BTC plunged faster and further as a result of a rapid decline in purchasing strength. The bearish thesis may be discredited if BTC crosses the $20,000 level.
A fall below that price mark could cause Bitcoin to drop as low as $17,400. If the asset’s price falls below this price point, it could bring it to $14,000
Bitcoin trading volume in the most recent session decreased, which indicates that the sellers are now the dominant party at the moment of writing.
Technical Analysis
Bitcoin prices fell even further after the fall in buyers. A sharp drop in purchasing power occurred just one week ago and BTC’s chart has been continuing to decline ever since.
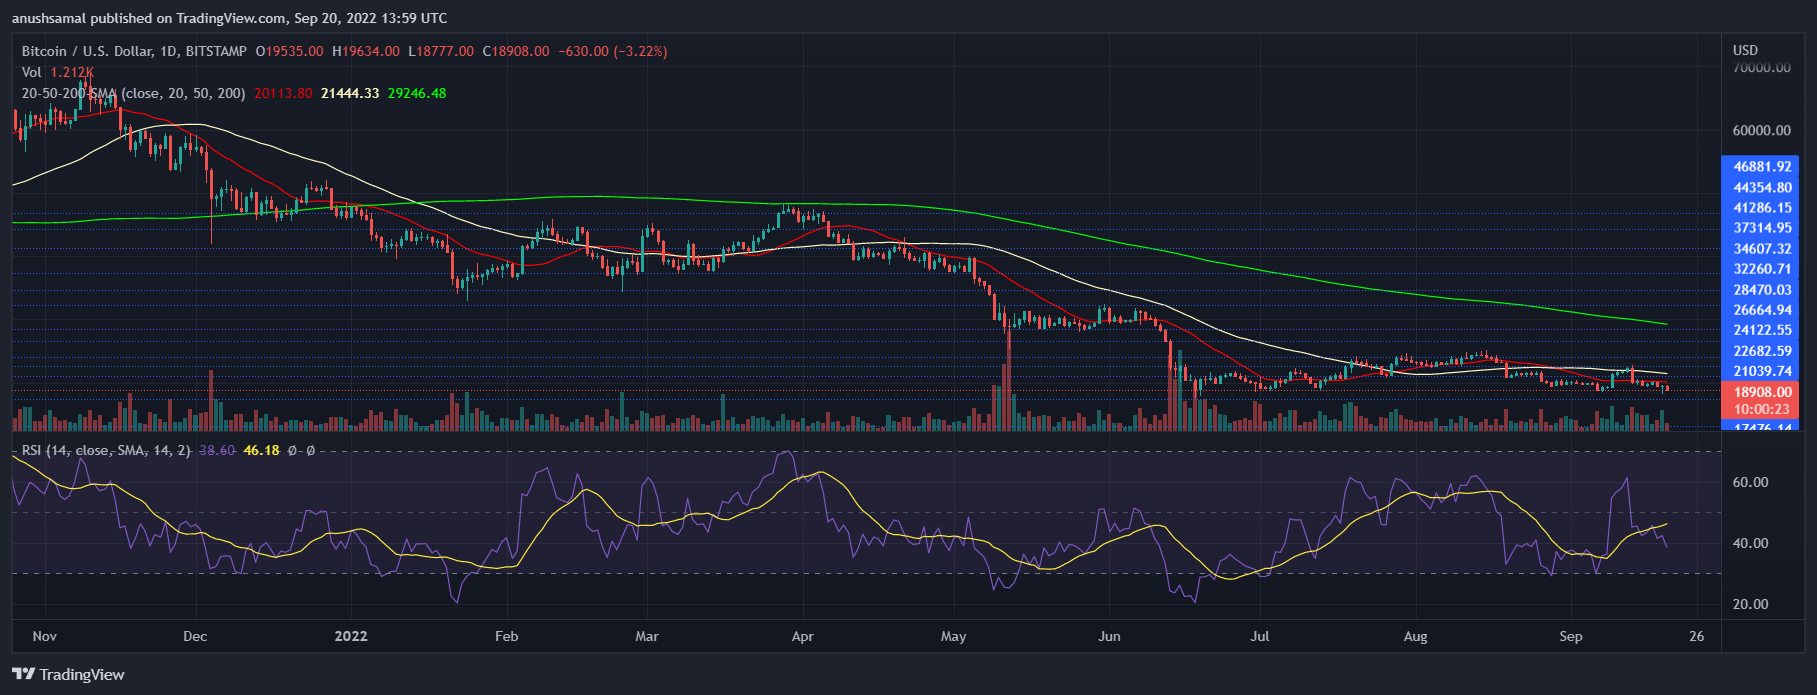
Relative Strength Index fell below half-line. This meant sellers were more numerous than buyers.
Bitcoin’s price fell below its 20-SMA level, showing a decrease in demand. This also indicated that the Bitcoin market was driven by sellers at the time this article was written.
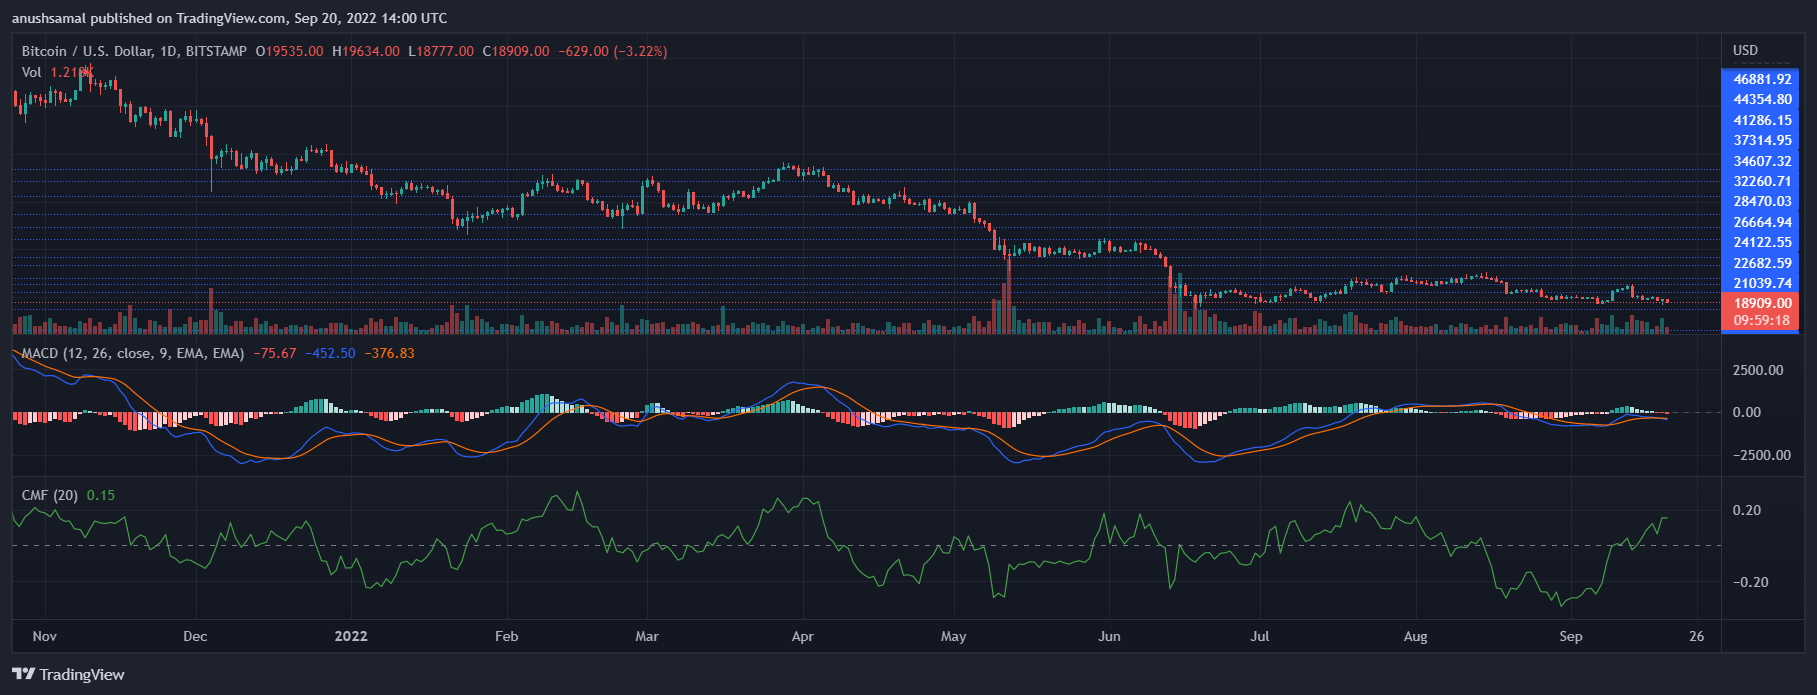
The bearish price signal was also indicated by other technical indicators. The Moving Average Convergence Divergence measure market momentum as well as overall market direction.
MACD was subject to a bearish crossover and displayed red histograms as sell signals.
Chaikin Money Flow was positive, however, with an increase above the half-line. It measures capital inflows or outflows.
CMF had increased capital flows at the time this article was written.