
Have you ever noticed how money seems to be quietly changing our futures? In 2022, private wealth reached a staggering $454.4 trillion. That number might make you pause and wonder if our ideas about money are shifting.
This isn’t just about big numbers. It feels like we’re seeing a change in how trends work, a nudge that might lead us to smarter decisions and different ways to invest. Think of it like the gentle ripple in a pond that slowly changes the whole scene.
When we look back at past trends and dream about what lies ahead, we see dynamic data quietly shaping our progress. It’s interesting how even tiny shifts in numbers can ripple through the markets and alter our everyday lives.
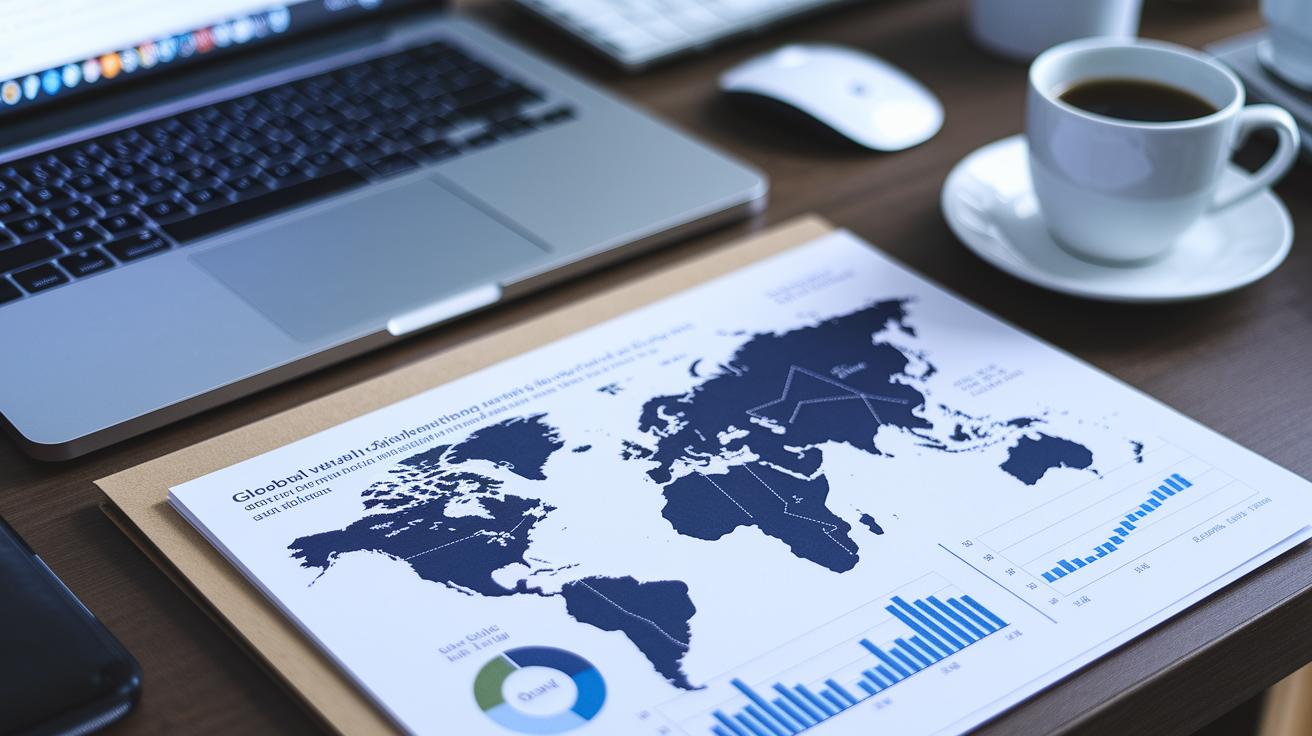
Global Wealth Snapshot: Total World Wealth and 2027 Forecast
Worldwide, the numbers paint a vivid picture. In 2022, net private wealth surged to $454.4 trillion, turning what once felt like a far-off dream into everyday reality. It’s like watching the gentle hum of a bustling market, steady, powerful, and full of promise.
Look back for a moment. Global assets leaped from $440 trillion in 2000 to a jaw-dropping $1,540 trillion by 2020. Net worth wasn’t left behind either; it climbed from $160 trillion to $510 trillion over the same period. Fascinating, isn’t it? These jumps are more than just statistics, they’re snapshots of a world in constant motion and growing confidence.
| Year | Total Wealth (trillion USD) |
|---|---|
| 2000 assets | $440T |
| 2020 assets | $1,540T |
| 2022 net private wealth | $454.4T |
| 2027 forecast | $629T |
These figures don’t just show us the massive scale of global wealth, they also hint at more growth on the horizon that could shift how we think about money. As trends like this continue, it’s a good idea to take a step back and wonder: How might these changes guide better financial choices and smarter investments around the world?
Historical Rise of World Wealth: Total Wealth Trends Since 2000
Between 2000 and 2020, the world's wealth grew threefold. Back in 2000, total assets were around $440 trillion and net worth was roughly $160 trillion. By 2020, those numbers had leapt to about $1,540 trillion in assets and nearly $510 trillion in net worth.
But this rapid growth isn’t just from new investments. It mostly shows a shift in how the market works and how we value things. Today’s numbers come with insights into how market mood, cheaper borrowing, and lower rental returns have pushed asset prices higher.
- Asset price jumps made up 77% of the net worth increase.
- Fresh investments contributed 28% to overall wealth growth.
- Lower global interest rates helped lift asset values.
- Declining rental yields added extra pressure on real estate prices.
All these points remind us that the surge in global wealth comes largely from changing market forces, not just from spending more money. Cheap loans have fueled higher asset prices, and softer rental income has boosted real estate values, giving the raw figures a deeper, more meaningful story.
Asset Composition of World Wealth: Total Wealth by Asset Type
When you break down wealth across different asset types, it helps us see how strong the global economy is and where risks might hide. In 2020, the real economy, the financial sector, and regular financial assets each hit about $500 trillion, around six times what the world's economy produces in a year. This mix not only shows our current stability but also hints at which areas might spark future growth.
Real Assets
Real assets are all the tangible things like our homes and the land they sit on. They make up about 46% of total net worth. Then you have corporate and government buildings along with their land, which add another 23%. Plus, productive items like factories, machinery, and infrastructure account for roughly 20% of these real assets. It’s like having different parts of a team, each plays a role in boosting the economy.
Financial Sector Assets
The financial sector is full of tools like stocks, bonds, deposits, and insurance products. These tools are a bit like a window into market feelings, letting us gauge how the economy is shifting. They show both wealth and sometimes a hint of potential ups and downs, depending on market conditions.
General Financial Assets and Liabilities
This part shows us that financial assets don’t exist on their own; they’re balanced out by liabilities to reveal the true net worth. As financial assets grow, liabilities adjust along with them. It’s a reminder that a clear picture of international wealth isn’t just about what you own, it’s also about what you owe.
In truth, the way wealth is spread out around the world plays a big part in keeping global stability. A blend of real assets, financial holdings, and liabilities offers insights into today’s strength and guides smart financial strategies for tomorrow.
Per Capita and Regional Patterns in World Wealth

When we talk about per capita wealth, it really gives us a peek into how money is spread out among people. It figures out the total wealth and shows us an average for each person, which helps us understand how well-off different communities are. This simple number can highlight differences in income and guide choices, from managing our own money to shaping national policies. For example, knowing that the world's average net worth per person was $66,000 in 2020 helps put other numbers into context.
Next, consider the extremes from different countries. In 2020, Mexico's average per person net worth was about $46,000, while Australia boasted an impressive $351,000. These differences remind us that some countries enjoy high financial security, while others struggle to build wealth. It’s a clear sign that economic fortunes vary widely around the globe.
Then there’s the net worth-to-GDP ratio, which further shows regional differences. In the United States, the net worth is about 4.3 times its GDP, while in China it jumps to 8.2 times its GDP. These ratios not only tell us about the depth of wealth compared to economic output, but they also hint at underlying differences that affect how economies grow and stay stable.
Household Share of World Wealth: Distribution of Total Wealth
Households hold an amazing 95% of the net worth in the economies surveyed. Back in 2000, they were at 4.2× GDP, and by 2020, that number climbed to 5.8× GDP. Think of it like watching your neighborhood save money steadily over the years. Everyday people really form the base of global wealth, and this growth shows a clear shift in how our economy is structured.
Now, here’s something to chew on: financial assets and liabilities have raced ahead of GDP growth. Assets jumped from 8.5× GDP to 12× GDP. For every extra dollar of new investment, there’s an added two dollars of debt and four dollars in overall liabilities. It’s kind of like a balancing act where borrowing rises along with asset gains, setting the stage for tougher decisions down the road about how we manage resources and keep our financial system strong.
Economic Implications of World Wealth Trends: Priorities for Total Wealth Utilization
Recent years have seen asset values skyrocket far beyond what we'd expect from typical income figures. This burst in pricing might seem exciting, but it raises some red flags. Think about it: if we suddenly go back to historical price levels, markets that seem solid today could quickly stumble, catching investors off guard. It’s a reminder that even impressive numbers might be hiding deeper financial risks.
Right now, only around 20% of real assets are funneled into investments that actually fuel economic growth, like building factories, purchasing machinery, or updating technology. This imbalance shows a clear chance to shift money into the parts of the economy that really make a difference. By putting more cash into industries that create jobs and drive progress, we could mix the fast gains of asset prices with steadier, long-term growth.
On top of that, liabilities are growing much faster than actual investments. When every new dollar put into the market comes with an even bigger chunk of debt, the whole system gets more fragile. This suggests that policymakers might need to step in. Maybe they’ll tighten credit rules or tweak fiscal policies to slow down the debt while still supporting growth. In truth, smart, proactive policies could soften the impact of market swings and help build a more sustainable financial future.
Final Words
In the action, we examined the modern scene of global fiscal growth. We saw how asset performance and household holdings reveal key trends in total wealth in world markets. Each section helped map out current snapshots and hints at the future of our financial structures.
The blog post offered a quick yet clear look at evolving asset mixes, per capita benchmarks, and economic implications. This robust insight leaves us looking ahead with caution and optimism.
FAQ
What is the total wealth of the world in 2022 and how is it measured?
The total wealth in the world is estimated at around $454 trillion in net private wealth for 2022, with overall assets measured in trillions. This figure reflects the massive economic scale adjusted by global population.
Which countries rank among the richest in the world?
The top richest countries are ranked by metrics like GDP and per capita wealth. Lists often highlight the top 10 and top 100 by comparing economic strength and asset accumulation across nations.
How does a net worth percentile world calculator work?
A net worth percentile world calculator estimates your ranking by comparing your assets and liabilities against global data. It helps you understand how your net worth stands among international peers.
How is global wealth distributed and who owns most of it?
Global wealth distribution shows that households hold the majority of wealth. Most assets are concentrated in wealthier countries and among high-net-worth individuals, highlighting significant disparities among nations.
How is “wealthy” defined in a global context?
Being considered wealthy varies by region and economic standards. In many cases, having a net worth well above the global per capita value—roughly around or above $66,000—signals a high level of financial prosperity.