
The consolidation phase was not a problem for Uniswap. The altcoin’s price has risen by over 4% in the past 24 hours. It has seen a surge of close to 8.8% in the past week. That can be translated as a rally.
Since the altcoins moved north on their charts, UNI is a consistent green coin. The coin’s technical outlook also agrees with the bullish force.
Uniswap needs to keep its momentum going and continue trading above the price ceilings. Otherwise, the bulls may soon lose strength.
The bulls have received support from buyers. The one-day chart shows that Uniswap demand grew significantly.
To ensure that UNI is under bullish control, it must trade above $8.
The Uniswap Price has maintained higher highs that are linked to bullish momentum. Today, the global cryptocurrency market was worth $1.04 trillion. 0.5%Positive changes in the past 24 hours
Uniswap price analysis: One-day chart
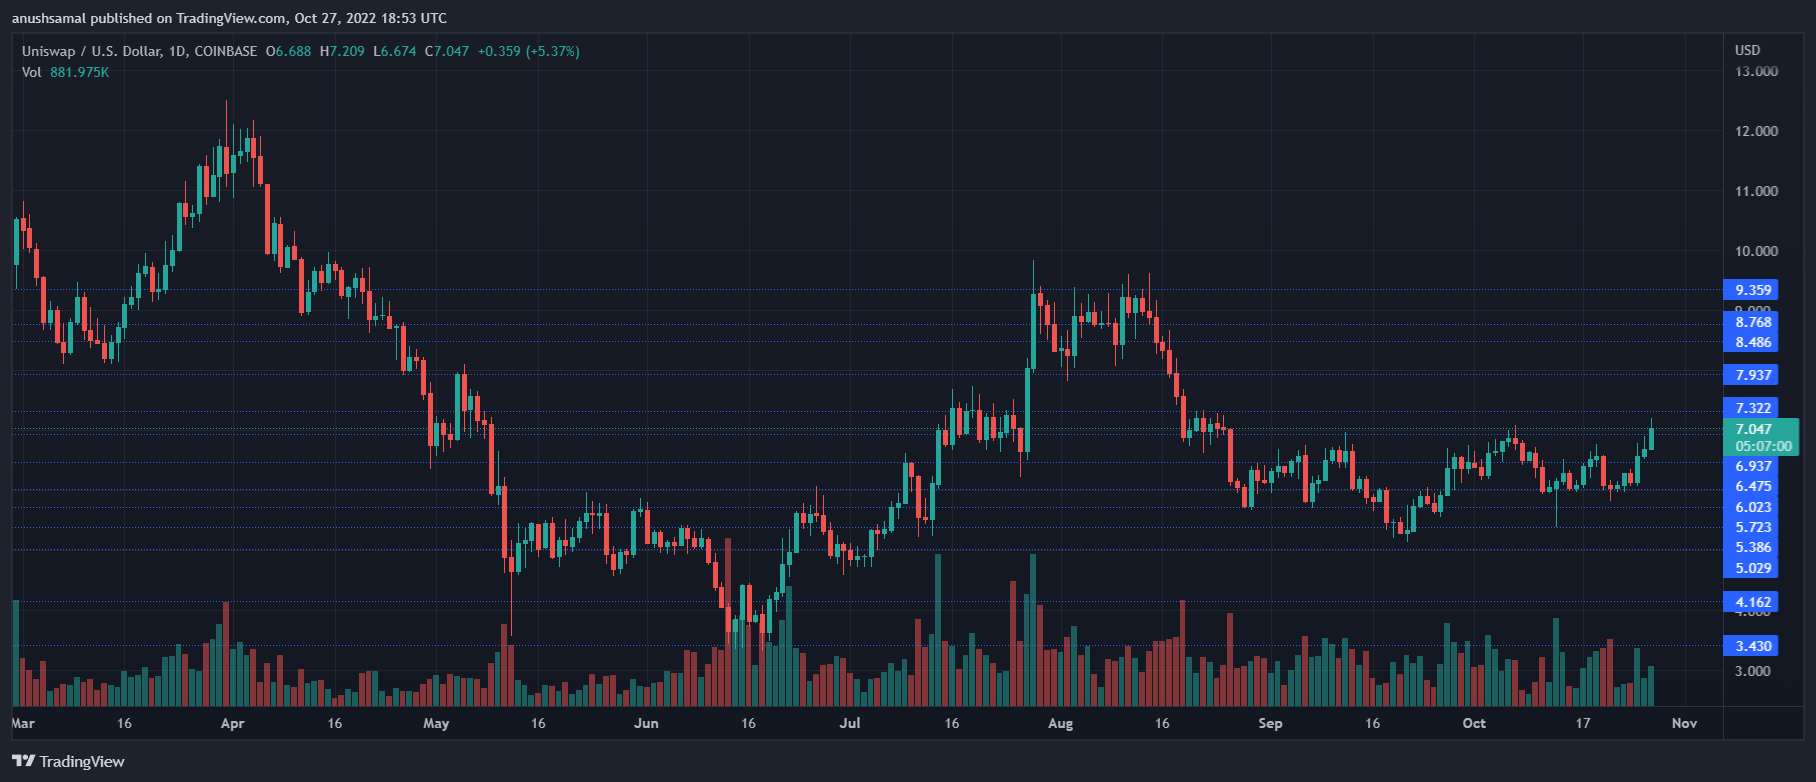
As of this writing, UNI was at $7.04 For the past weeks, the price of UNI has been struggling to exceed $7.
The bulls were able to surpass the $7 mark due to market strength. It was immediately confronted with resistance at $7.40.
This price level is crucial for the coin. The bulls will need to break $7.40 before the coin can trade at the $8 price point.
If the price falls below this level, the altcoin will fall to $6.47 and then the $6.02 support level. Also, the amount of UNI that was traded during the previous session increased. This indicates that there were more buyers.
Technical Analysis
For the past month, altcoins have seen greater selling pressure than buyers strength. The chart is finally showing buyers after its break from lateral trade.
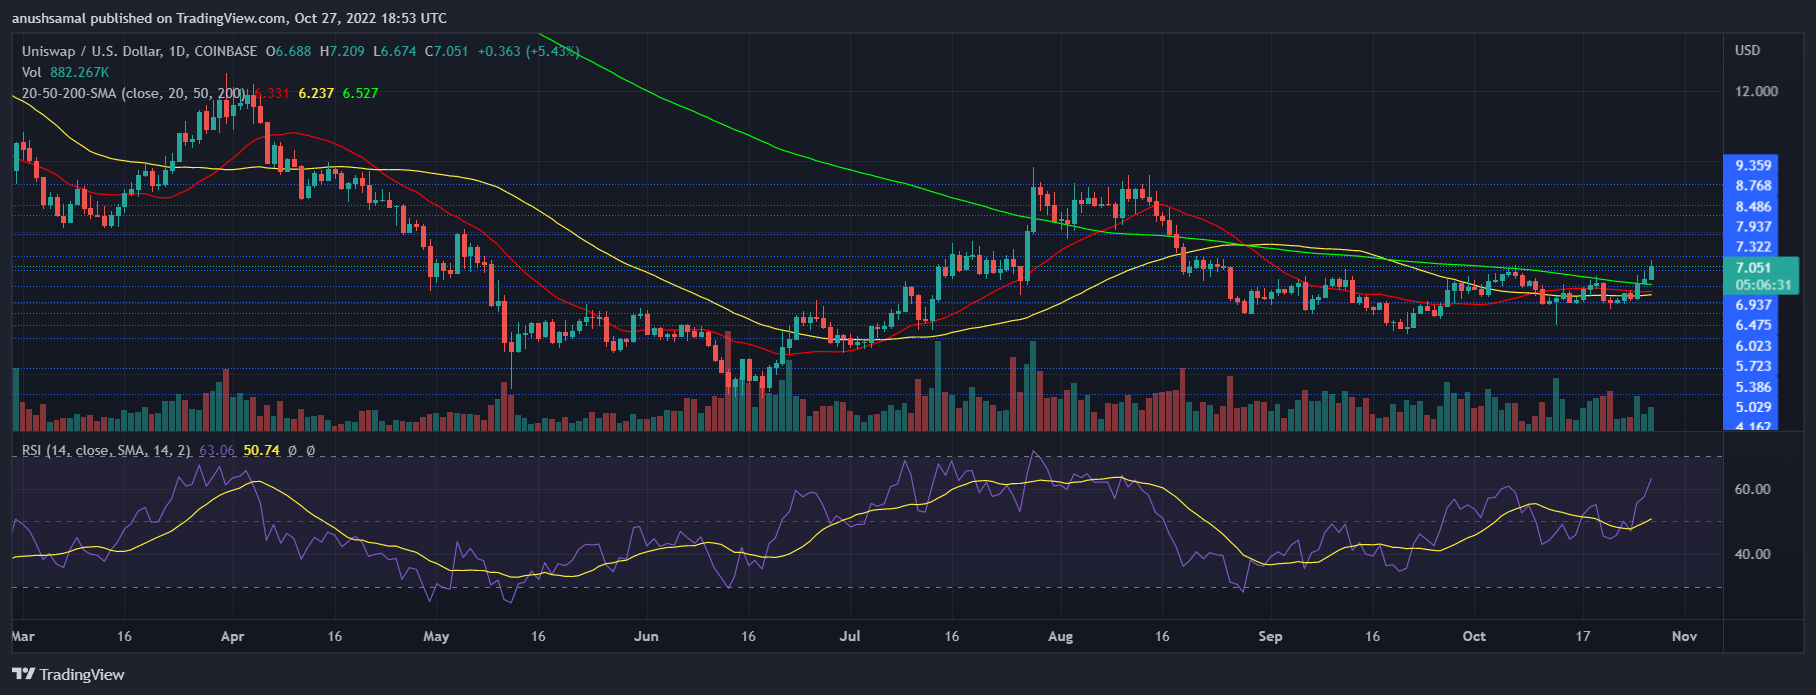
Relative Strength Index (RSI) was higher than 60. This is bullish because there are more buyers than sellers.
UNI also formed a bullish engulfing structure. This occurs when the chart shows larger-sized, greener candles. This pattern indicates positive price action.
The Uniswap price was above the 20-SMA line which signified growth in the altcoin’s demand. This also indicated that buyers drove the price momentum.
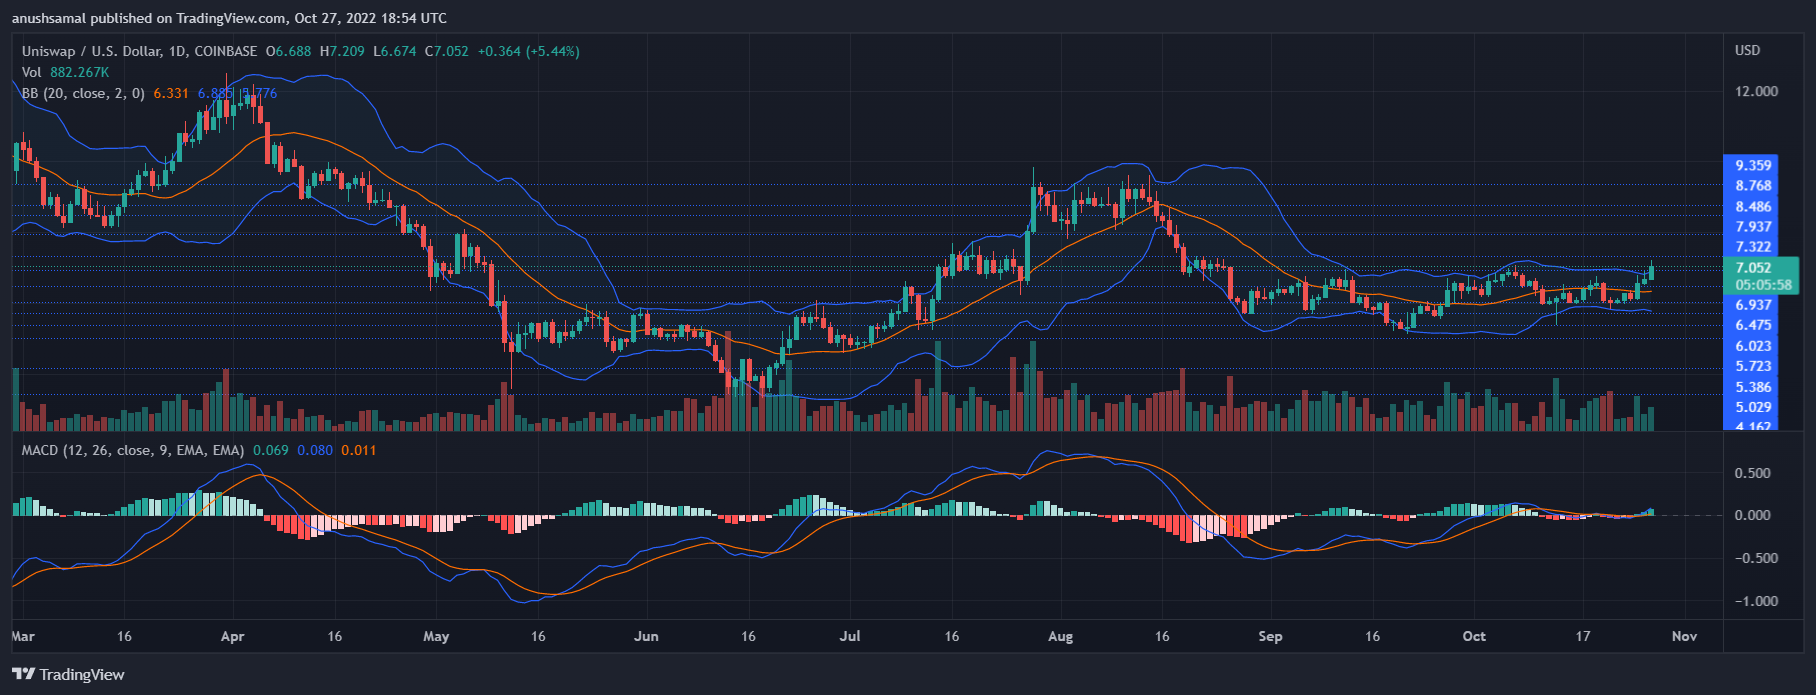
UNI had a bullish effect, which was also confirmed by technical indicators. Moving Average Convergence Divergence is a measure of the asset’s strength and direction.
MACD experienced a bullish crossover. It then formed green histograms. These signals were the buy signals for altcoin. Bollinger Bands indicate price volatility or price fluctuations.
It was clear that there would be no sharp price volatility in the future trading sessions, as they were moving parallel.