Bitcoin new address momentum is approaching a retest that could change the course of the crypto’s price, if history is anything to go by.
The Monthly MA of Bitcoin New Addresses is currently being tested.
The latest Weekly Report from Glassnode shows that new address momentum appears to be on the rise.
The “new addresses” is an indicator that measures the total number of new addresses coming active on the Bitcoin blockchain.
To know whether the crypto is seeing a sufficient amount of push in new users coming to the network or not, the “new address momentum” metric is used.
The momentum indicator uses the moving averages for new addresses over the past 30 and 365 days. Comparing these MAs to each other allows us to see how monthly average users compare with the annual mean.
Below is a chart depicting the Bitcoin momentum in recent years.
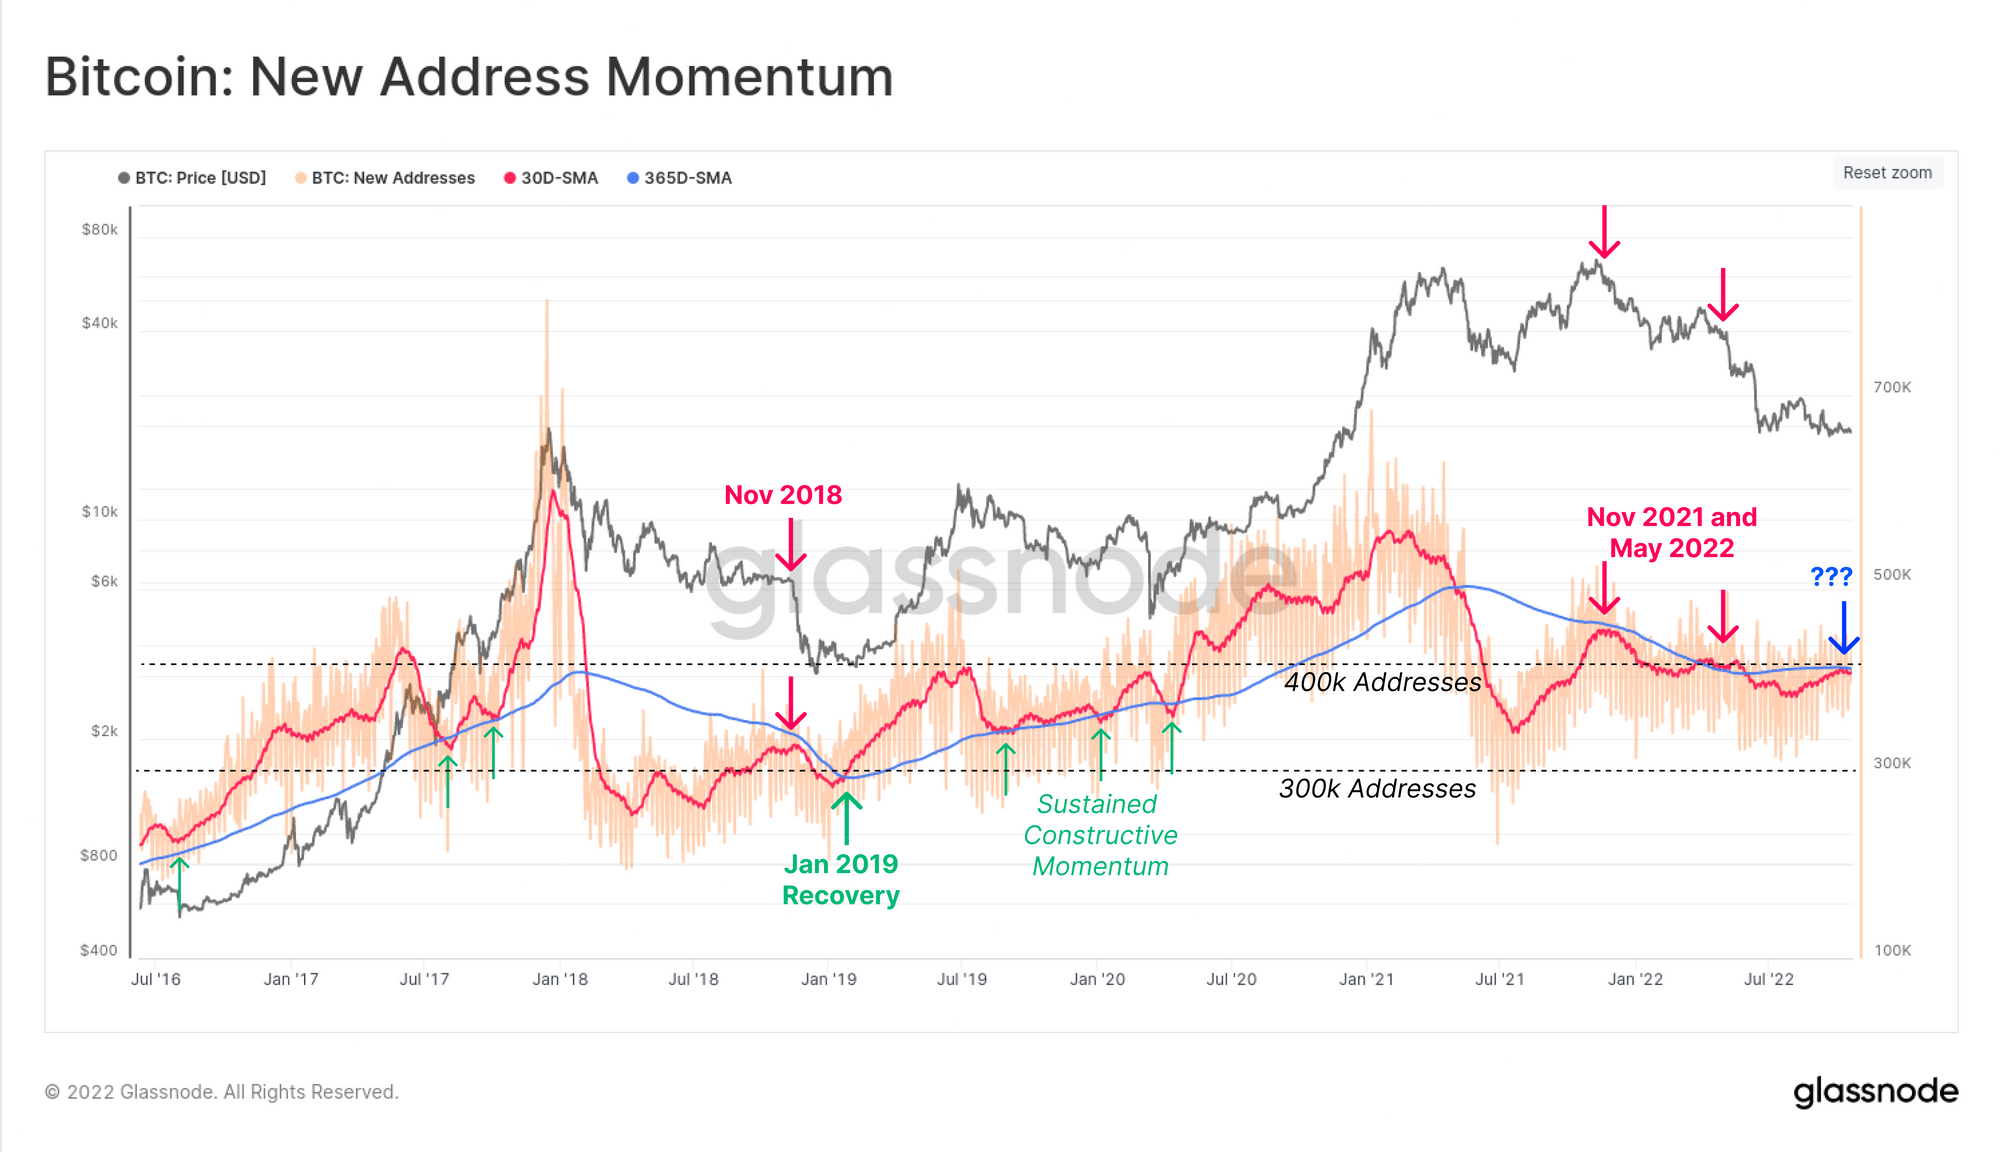
The MAs appear to be approaching the test. Source: Glassnode's The Week Online - Week 43, 2022| Source: Glassnode's The Week Onchain - Week 43, 2022
The graph above shows the key trends for Bitcoin’s new address momentum.
The price of crypto seems to have exhibited a bearish tendency whenever the 30-day MA fails to surpass the 365 day MA.
This happened back in November 2018, where when shortly after the crossover didn’t happen, the coin crashed from $6k to $3.2k November 2021 and May 2022 also saw a similar pattern.
Bitcoin’s value felt positive during periods when its monthly MA exceeded the yearly.
In recent months, the 30-day MA has been below the 365-day as there hasn’t been much demand for BTC. Recently, however the metric experienced an upwards push and is nearing another retest.
Currently, it’s unclear how this crossover attempt will go, but the report notes that so far the market hasn’t shown the same convincing burst of strength as in 2019.
BTC price
At the time of writing, Bitcoin’s price floats around $19.2k, down 1% in the last week. The crypto’s value has increased by 2% over the last month.
Below is a chart showing the change in coin price over the past five days.

According to TradingView, the value of crypto appears to have continued its sideways trend around $19k.| Source: BTCUSD on TradingView
Featured Image from Kanchanara, Unsplash.com. Charts from TradingView.com and Glassnode.com.


