The Solana price got off to an excellent start this week, despite the turbulent market. Over the past 24 hours, bulls seem to have lost their energy. Altcoin has fallen by 3.3% in the last day. In the past week, Solana has seen an increase of nearly 6%.
As of press time the technical indicator indicated that the bears held control. If buying strength continues to head in the same direction, then most of the coin’s weekly gains would be nullified.
As the coins were being sold at that time, their technical outlook was not favorable.
The coin’s current support zone is $33 to $26. The chart will show bear momentum if SOL drops below the current price.
Bitcoin fluctuating around $19,000, altcoins began to show signs of woe on their charts. They moved closer towards their support levels.
The demand for Solana must rise on the chart in order to bring Solana to its next maximum price.
Solana Price Analysis: One Day Chart
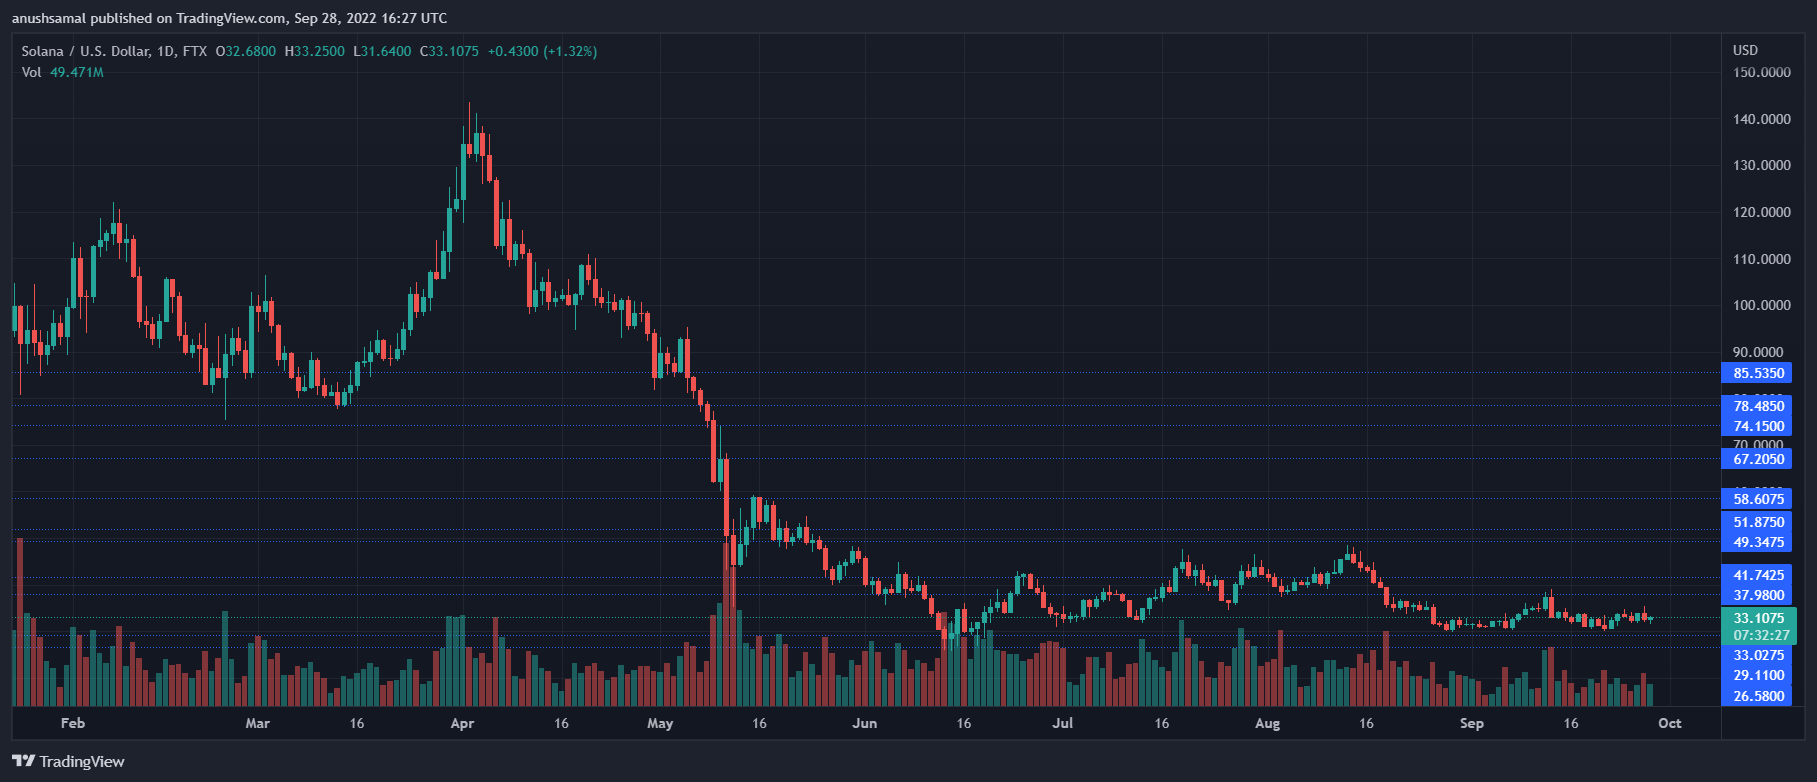
SOL traded at $33 when this article was written. However, the coin’s recent gains were offset by resistance. It fell on its chart.
Initial resistance was $38 for Solana, and then a price ceiling of $41 followed. Bulls may emerge on the chart if Solana prices move higher than $41.
The altcoin would trade at $26 if it fell below $29 as the support level.
Altcoin volume traded fell in the last session. This indicates that the chart’s buying power has declined.
Technical Analysis
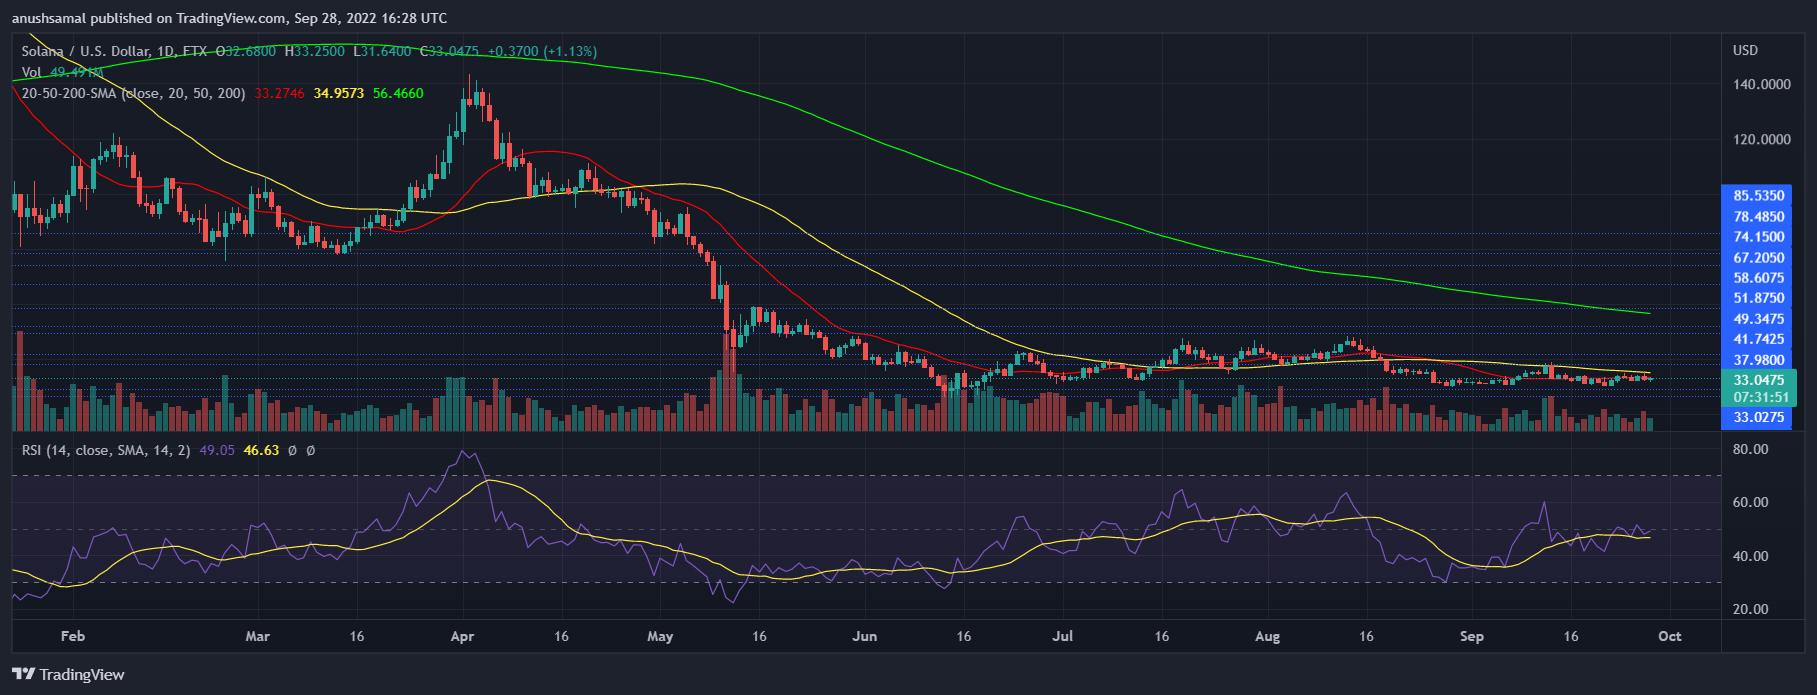
Altcoin’s one-day chart showed greater selling power. Solana hasn’t seen a spike in buyers despite its gains over the past few days.
Also, this meant there was more demand at lower levels. Relative Strength Index saw an improvement and it was near the halfway point. That means that buyers and sellers were equal.
Other indicators are however aligned to the chart’s selling power.
Solana prices were below the 20 SMA line. This indicated that buyers are driving price momentum. SOL may rise slightly if there is an increase in demand.
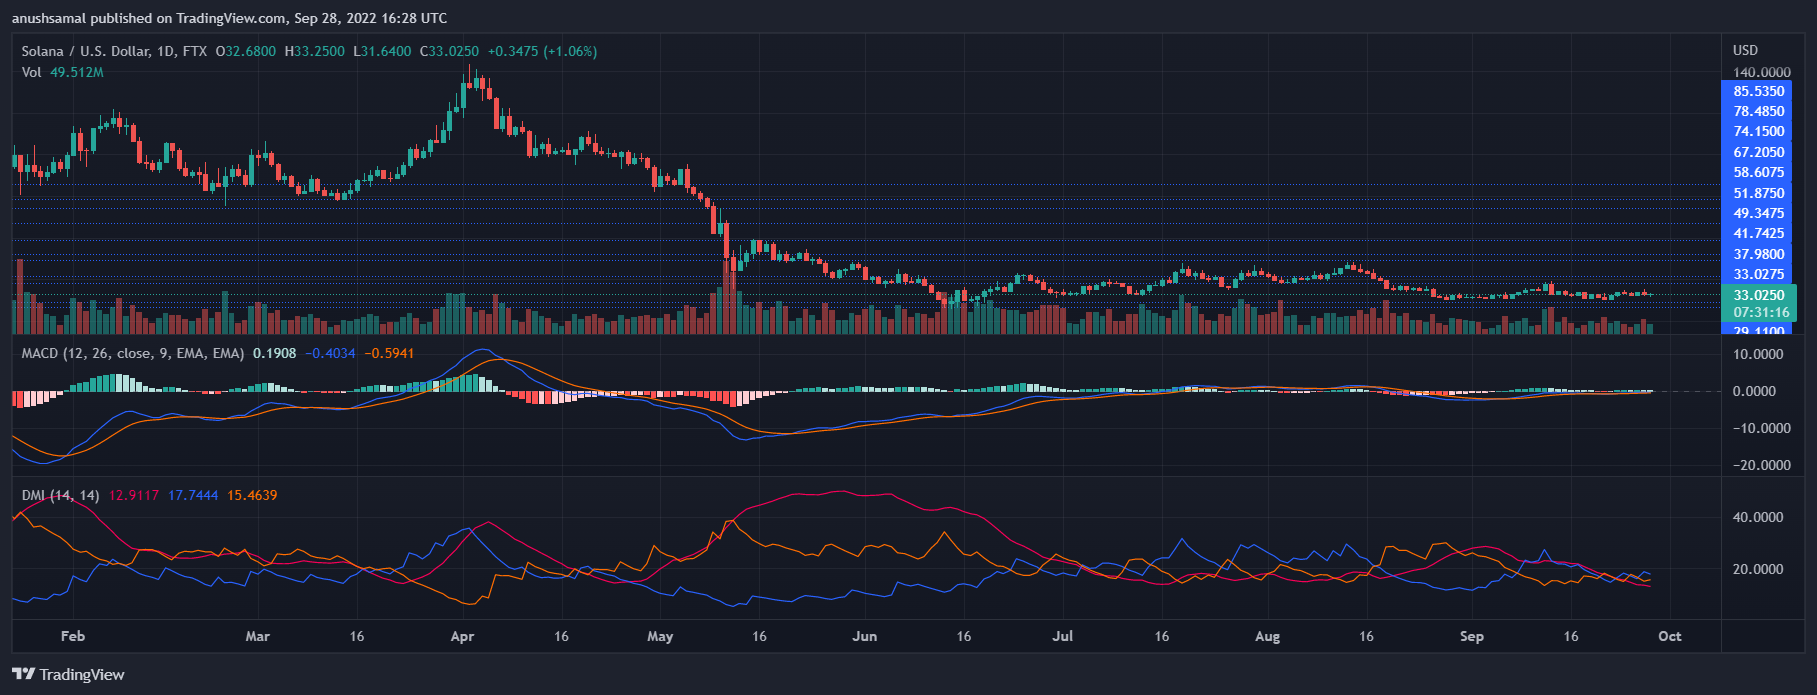
SOL’s other technical indicators were yet to turn entirely bearish, although the indicators depicted the onset of bearish pressure.
The Moving Average Convergence Divergence indicates price momentum and general price direction.
Green histograms continued to be displayed by the MACD, which was a buy signal for this coin.
It was also a sign that the positive price momentum was in decline as indicated by the declining green signal bars.
Directional Movement Index displayed price momentum. It was positive because the +DI was greater than the –DI.
The Average Directional Index fell below 20. This indicates that current market activity was less strong.


