
Solana’s price finally broke the $30 level and turned it into a support zone. SOL gained 6% over the past 24 hours. Over the week, SOL has moved up by 4 percent.
Many altcoins have seen a rise in their prices due to the Bitcoin rally. Major altcoins have traveled northbound as they followed Bitcoin’s price action.
Solana’s technical outlook shows bullish price action. Buyers are now entering the market because of increased demand.
SOL’s next price movement remains crucial. As the bulls gain more momentum, a move above $34 is crucial for SOL.
A chance for trading near $37 is also available if Solana fails to break the $34 price barrier. SOL may trade at the $34 mark if there is still high demand.
It will be determined whether the altcoin is bullish at its next trading session. Global cryptocurrency market capitalization today stands at $1.04 trillion. 6.9%Positive changes in the past 24 hours
Solana Price Analysis: One-Day Chart
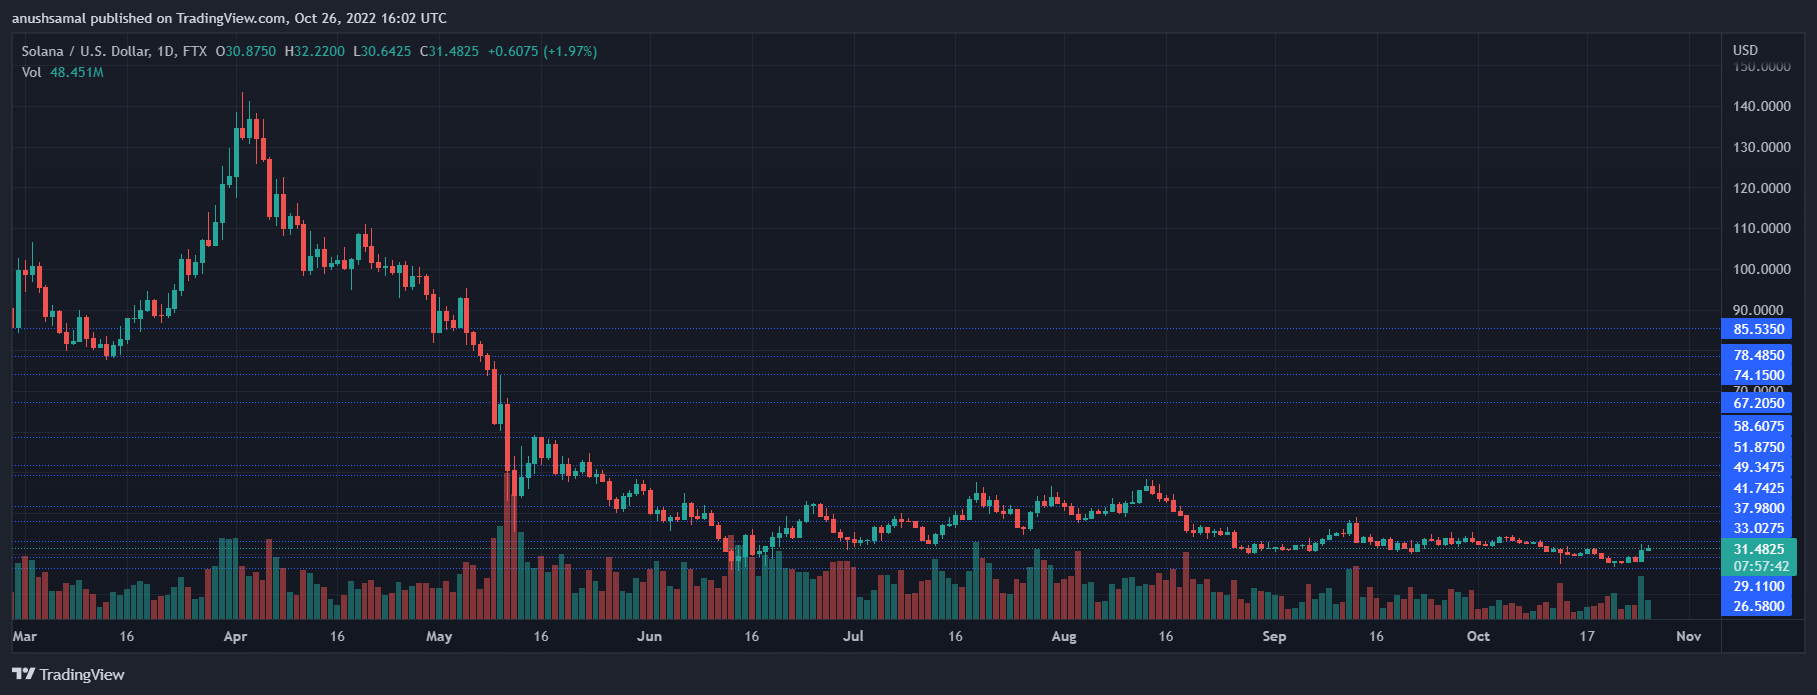
SOL traded at $31 as of the writing. SOL broke through its $30 price mark which was long acting as resistance.
Although Solana may find it difficult to break the $33 mark at the moment, moving above that price will allow SOL to cross the $37 threshold.
However, Solana’s price can slip as a result of a loss in momentum by the bulls to the downside. It will drop below $29. Another major support level for the coin was $26.
In the most recent trading session, Solana was traded at a higher level. This is a sign that Solana has high buying power and is in demand.
Technical Analysis
The market has slowly seen buyers return. There hasn’t been any major recovery in this area.
Although technical indicators tend to be positive, it’s important that SOL does not move below its immediate price limit.
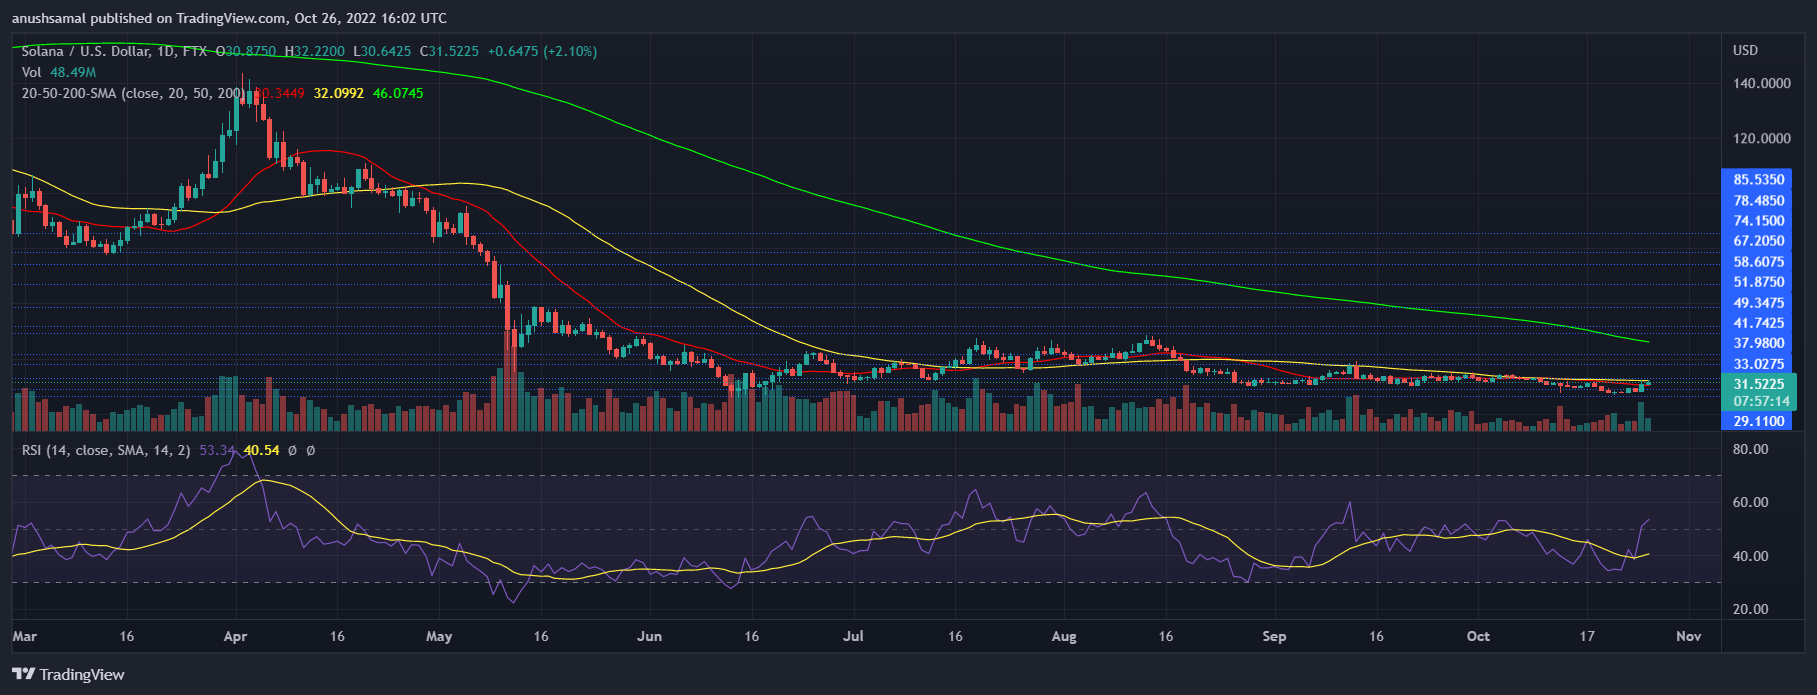
Since buyers bought the chart, Relative Strength Index was above 50%.
Solana’s price also crossed above the 20 SMA, which indicated that buyers were driving price momentum on the market. As demand increased for the altcoin, solana was also higher than the 20 SMA.
Other indicators also supported the bulls in the one-day charts, which indicates that selling strength was higher than buying strength.
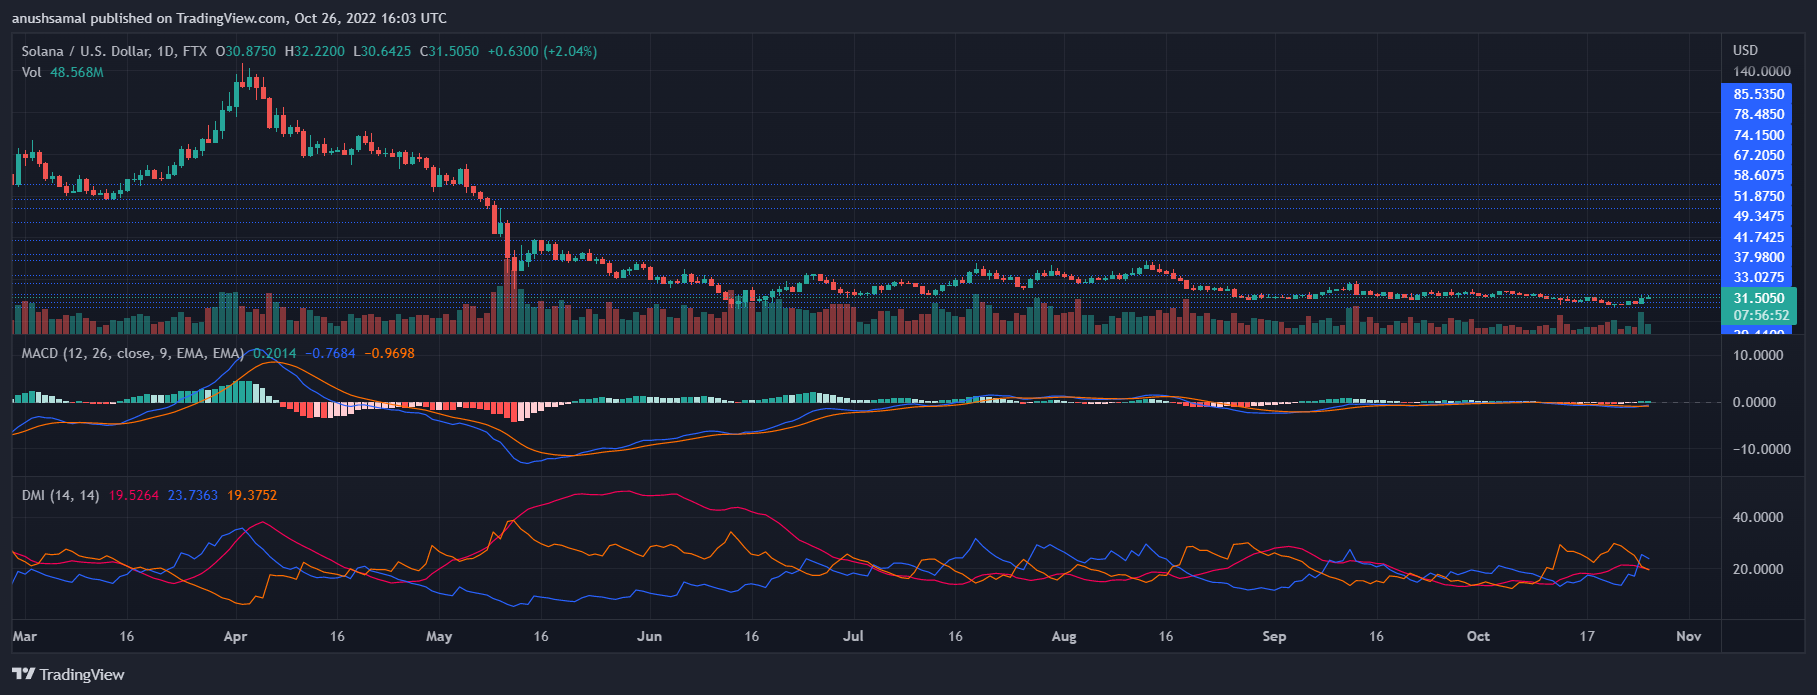
Moving Average Convergence Divergence shows the direction of the prices and the strength of the momentum.
MACD was a picture of green histograms. They were used to signify the Solana buy signal. Directional Movement Index shows the direction of price.
The DMI index was positive because +DI was higher than the -DI. Below 20 was the Average Directional Index in red, which indicates that price direction is becoming weaker.