
Monero has maintained a bullish trend despite the wider market trends. XMR continued to climb on its chart over the last 24 hour. The gain was close to 4%.
In the past week, Monero price gained significantly as there was a 9% appreciation on the altcoin’s chart. On the 1-day chart, the technical outlook was positive for Monero.
Over the last few days, Monero experienced very low buying pressure. The technical indicator showed that buying power was now recovering. This could indicate that XMR might be heading close to its next resistance point.
XMR’s bullish momentum could be maintained by increased demand. Monero’s support zone was $146-$136, respectively.
Bitcoin rose also on charts, helping other altcoins recover from their respective lows.
Monero must move over the $146 mark. If XMR demand increases and stays consistent, this could be possible.
Monero Price Analysis: One Day Chart
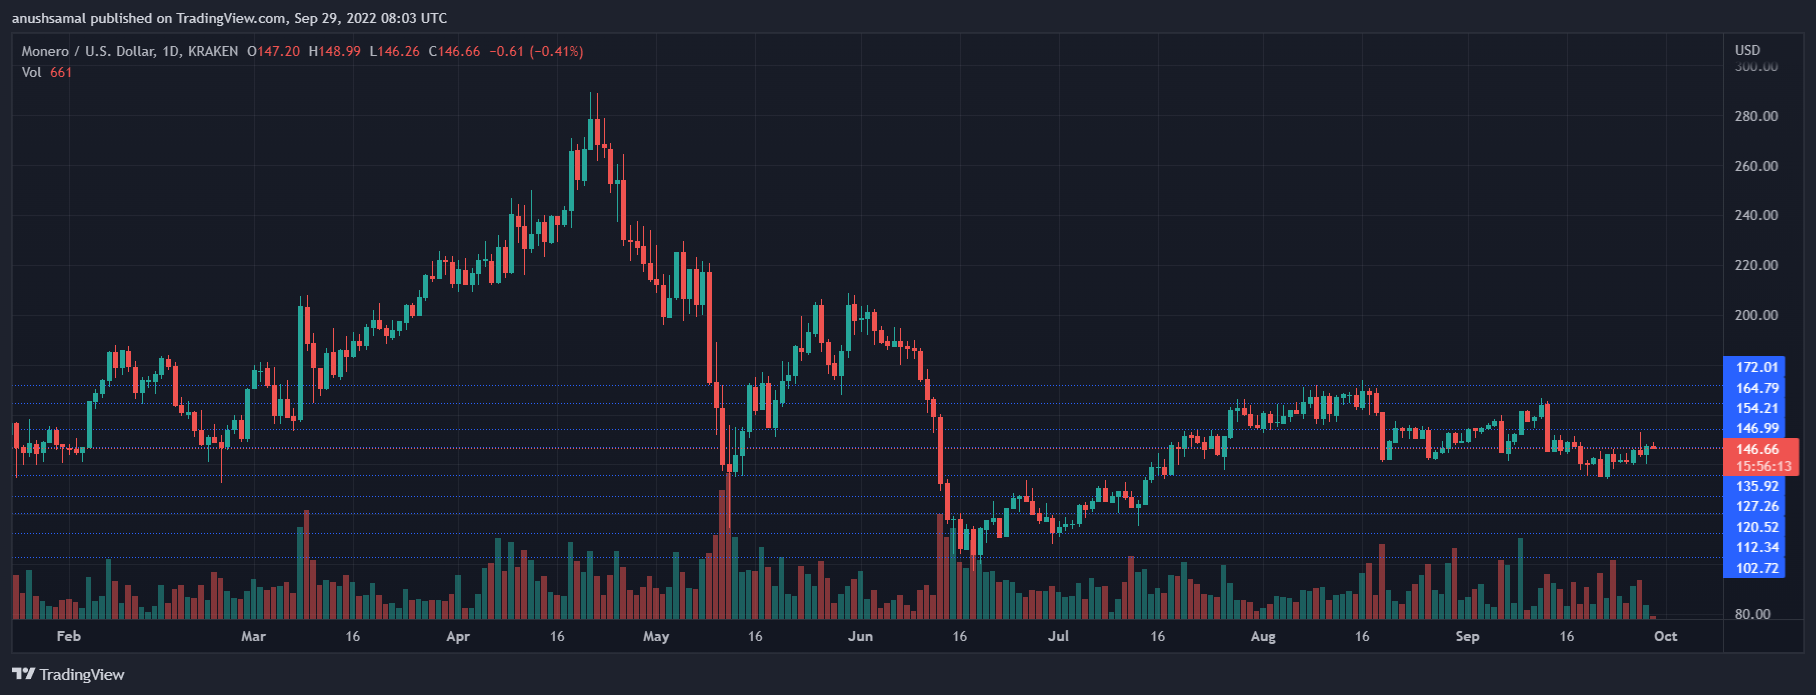
XMR traded at $146 as of the writing. The coin’s immediate resistance level was $154. For the bullish streak of the chart to grow, it must surpass that resistance level.
Monero’s other price limit that is difficult to surpass would be $163. Multiple weeks have passed since the bulls were rejected at $163.
If Monero prices experience a pullback then the Monero price threshold would drop to $134. XMR may drop to $127 if the price falls below $134.
Monero volume traded during the previous trading session fell, which indicates that the selling strength was declining at the time this article was written.
Technical Analysis
XMR’s technical indicators have reflected the increase in buying strength, painting a positive price action. XMR could move higher on its chart if the selling strength drops.
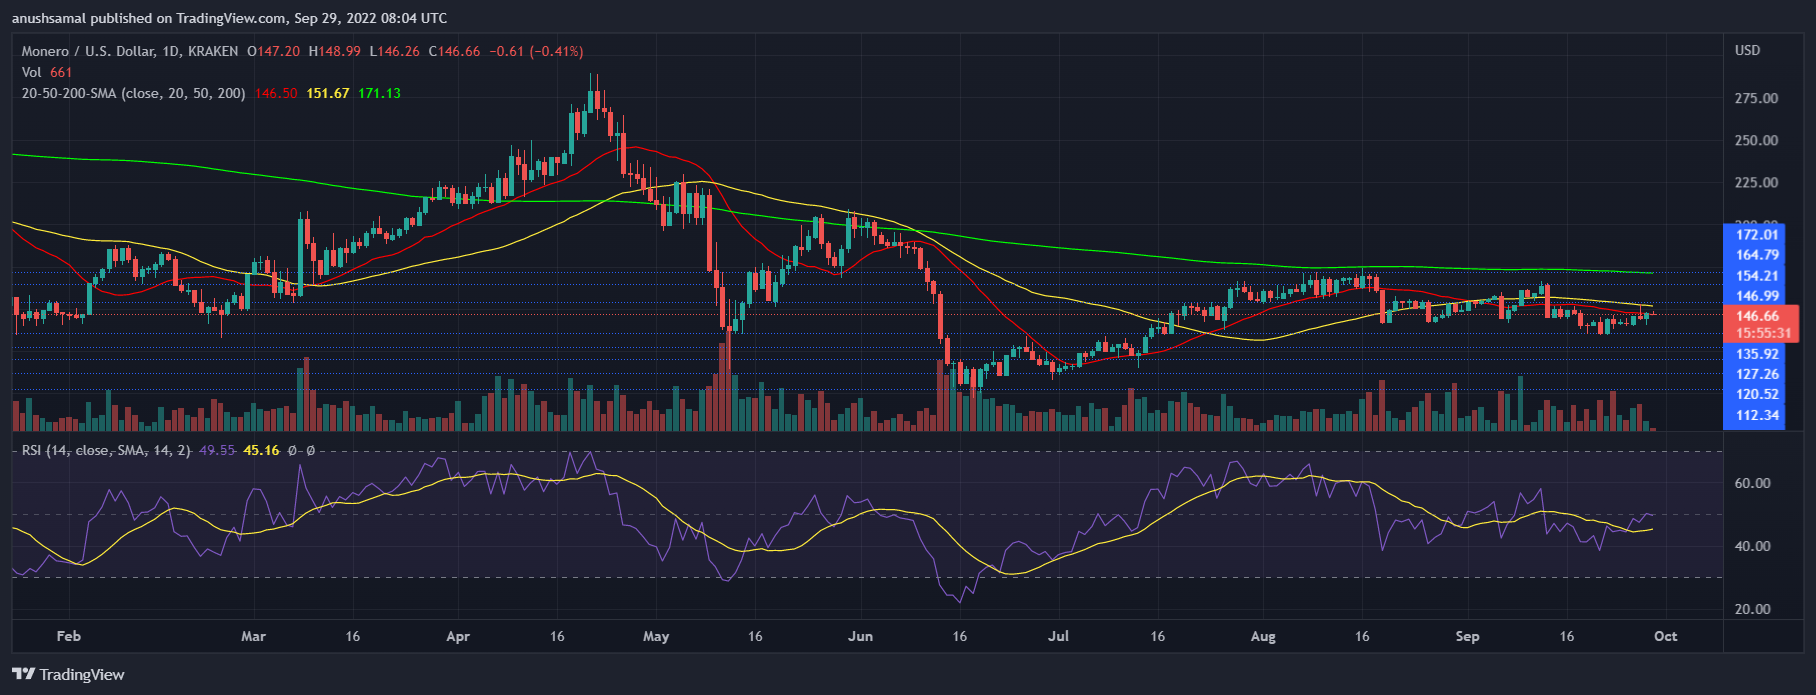
The Relative Strength Index rose to the halfway mark, while buying and selling strength are almost equal.
The chart was more in favor of the buyers than the indicator indicated. Monero prices rose to above the 20 SMA when buying strength improved. The market was also experiencing buyers’ price momentum.
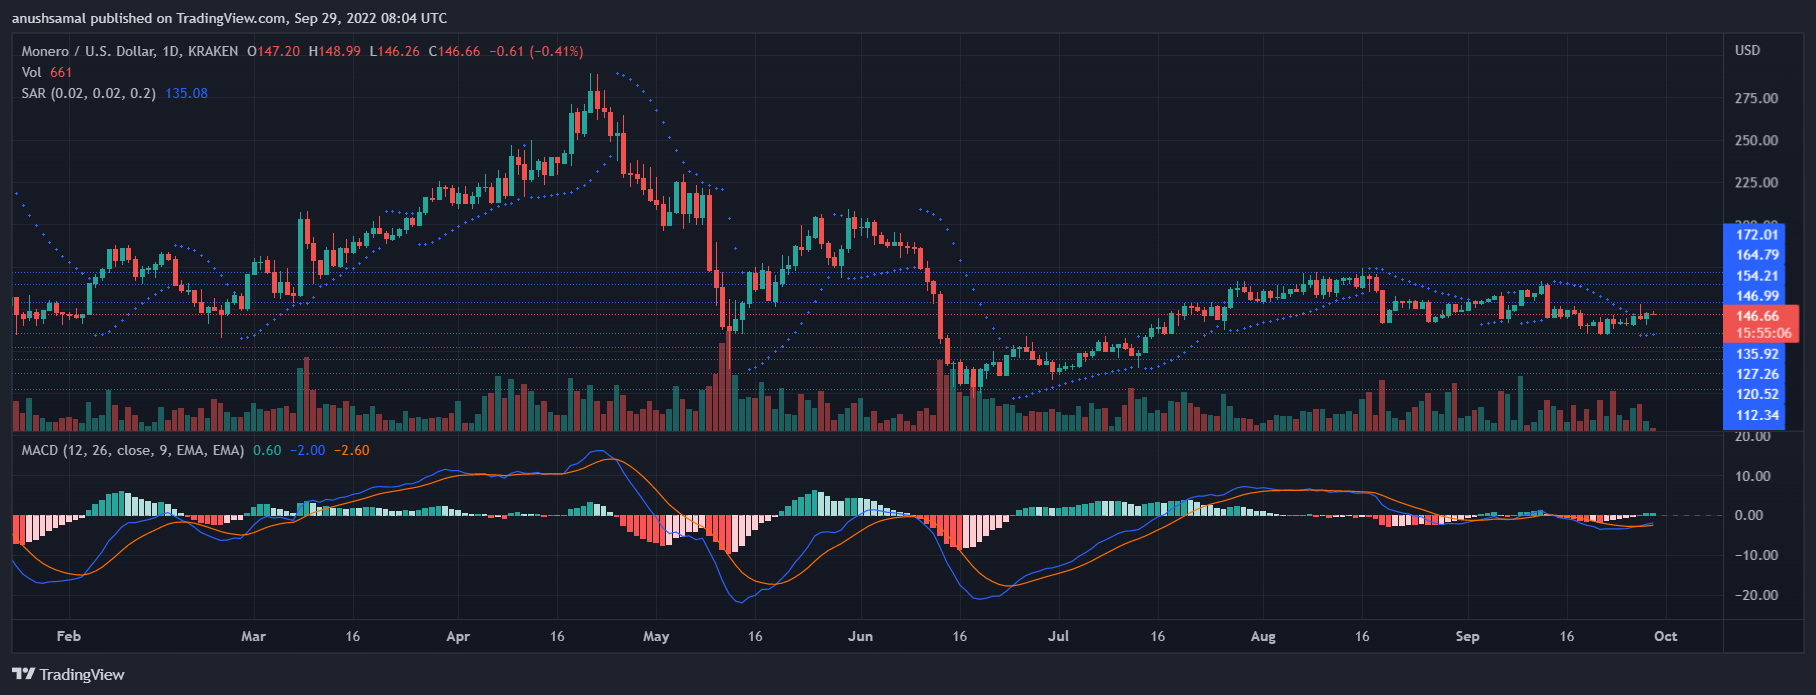
XMR’s other technical indicators are also inclined towards the bullish side. Moving Average Convergence Divergence indicated price momentum.
MACD experienced a bullish crossover. It formed green signal bar, which meant that the coin was now a buy signal. Parabolic SAR is used to determine the direction in which a crypto’s price will go.
Monero prices are in an upward trend if the dotted line is below the candlestick.