
Ever notice how a small shift in home building can be a sign of bigger market changes? New home starts count each new project each month, giving us a quick glimpse of builder confidence, like catching a brief, honest snapshot of the mood in the industry.
Recent numbers suggest builders are feeling upbeat, which might mean a change in the market is on the horizon. This simple yet powerful indicator helps both investors and developers get a clear idea of what might be coming next.
Curious to see how these trends could shape the future of real estate? Let's dive in and explore the possibilities.
Understanding the Housing Starts Indicator
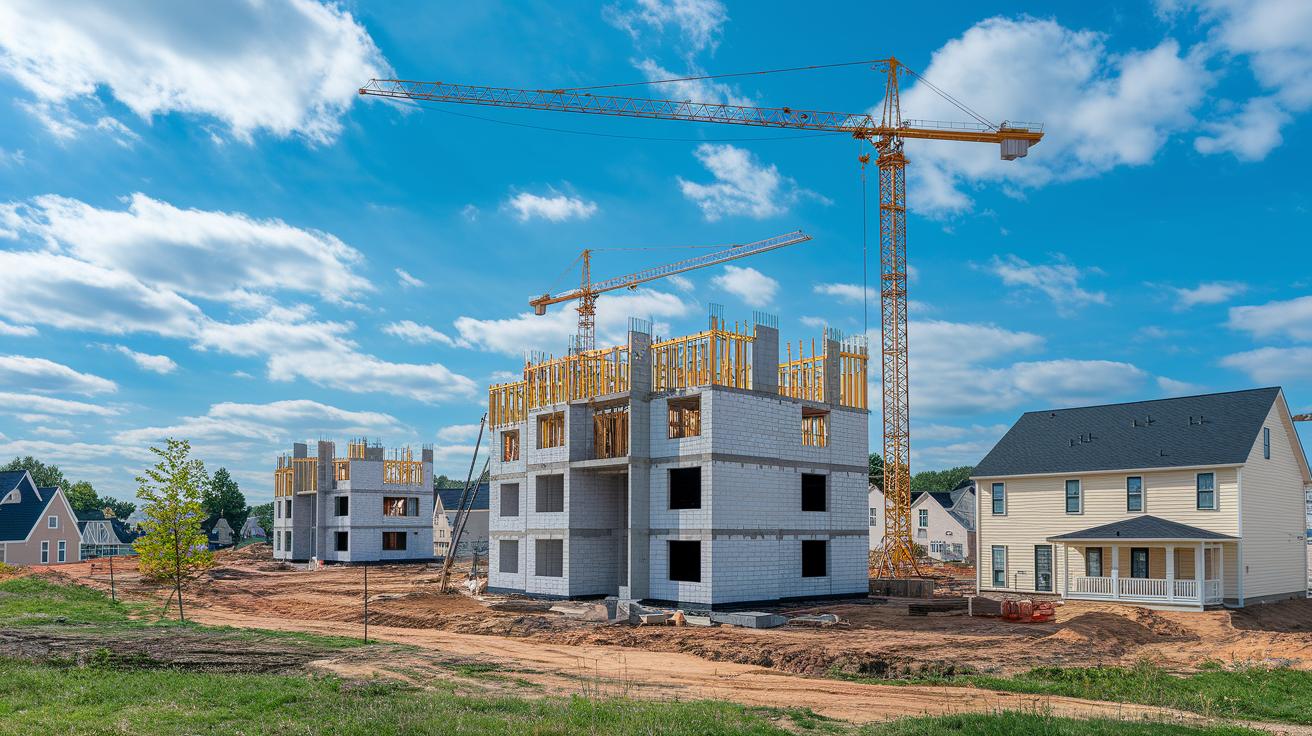
Housing starts count the number of new homes that begin construction over a specific time, whether it’s a month or a year. In October 2024, there were 1,311,000 single-family housing starts. That’s about 3.1% fewer than in September 2024 and a 3.96% drop compared to October 2023. When builders see these changes, they know the market is shifting. It’s like a quick snapshot of how confident people feel about buying homes and the overall health of the real estate market.
The peak hit in April 2022 reached 1.828 million starts per year, but now it’s below the long-term average of 1.432 million starts each month. This drop has many developers feeling a bit nervous about launching new projects. It’s also a handy forecast tool for new home construction, offering investors and professionals a clear picture of current market momentum. Think of it this way: when the number of new builds drops, it can quickly change the focus of development efforts.
Measuring Housing Starts Indicator Data
Housing starts data comes from the U.S. Census Bureau and the Department of Housing and Urban Development. They use trusted surveys like the Building Permits Survey and the Survey of Construction to gather this info. They then adjust the numbers to a seasonally adjusted annual rate (SAAR) so you can easily compare data over time. For example, in a November 19, 2024 report, October numbers set the pace for understanding current market trends.
These reports give a clear look at both single-family and multifamily projects. In multifamily developments, every unit counts on its own, so a 25-unit building registers as 25 separate housing starts. This neat detail lets market watchers count on housing starts as a reliable hint about overall construction momentum and timing for new projects. It’s like having a snapshot that shows exactly when new homes are joining the market.
Every month, fresh data comes in, painting an evolving picture of the construction industry’s health. By tracking these numbers consistently over time, experts use this indicator to gauge home development activity. It’s a steady way to capture today’s economic vibe and helps shape strategies for monitoring building permits and overall market pace.
Economic Significance of Housing Starts Indicator
Housing starts show us how the market feels about new home purchases. When we see higher numbers, it tells us buyers are optimistic and ready to invest. Builders often kick off more projects when interest rates drop, they lower borrowing costs and encourage construction. It’s much like noticing more people out for a walk on a lovely sunny day.
More housing activity means more jobs. With extra projects, there’s a greater need for construction workers, material suppliers, and other support services. This boost helps local economies grow. Multifamily projects, too, respond quickly to changes in rental markets, offering fresh opportunities that can ripple out and create even more employment.
Housing starts aren’t just about construction. They serve as a reliable glimpse into future market trends. A steady rise can hint at a vibrant, growing market, while a drop might make builders and buyers think twice. In short, housing starts act as a true pulse on both consumer moods and investor strategies.
Historical Trends in Housing Starts Indicator
Looking back at the start of home building tells a real story about where our economy has been. Right after World War II, a boom in housing had everyone feeling upbeat and ready for a big construction era. In the early 2000s, things got even more exciting when national averages jumped to over 1.5 million builds a year, showing that people were confident and eager to invest in new homes. More recently, these numbers have swung widely. In April 2022, we hit a high of 1.828 million builds on a seasonally adjusted annual rate, but by October 2024, the numbers had fallen below the long-term average of 1.432 million. These shifts really show the ups and downs that have defined the housing market over time.
| Period | Starts (SAAR) | Notes |
|---|---|---|
| Post-World War II | N/A | A time of rapid home growth. |
| Early 2000s | Above 1.5 million | High consumer trust pushed builds higher. |
| April 2022 | 1.828 million | Peak construction activity was recorded. |
| October 2024 | Below 1.432 million | Numbers dipped below the long-term average. |
Taking a closer look at these milestones, you can see clear cycles in housing starts. Each phase, from the post-war surge to that early 2000s upswing, shows different reasons behind the jump in new home construction. The record high in April 2022 stands out as a moment when the market was really buzzing, while the drop by October 2024 reflects a more cautious, measured phase in the market’s rhythm. These figures not only highlight changing consumer moods but also give handy pointers for builders, suppliers, and investors alike. By studying these trends, folks can better predict what might come next and adjust their strategies accordingly. Historical data like this remains a trusted guide to help steer future decisions in residential construction, giving us a snapshot of both past and future market moves.
Forecasting Economic Outlook with Housing Starts Indicator
Housing starts serve as a handy early clue that helps us catch market shifts. They rely on fresh data and modern forecasting methods, cutting through the usual repetitive analysis.
- Adjust your investment strategies using updated forecasting models.
- Fine-tune cost management tactics as market trends evolve.
- Guide developers toward multifamily or renovation projects right when opportunities arise.
- Use tools like model portfolios, dashboards, and custom alerts to pick up on changing supply signals.
- Keep an eye on leading indicators to understand possible impacts on resale and rental markets.
These refined forecasting techniques mix tried-and-true data with current signals, giving investors and builders a smart way to act without rehashing old analyses.
Final Words
In the action, we broke down the housing starts indicator as a key measure of new housing projects and economic health. We walked through how data is gathered, reflected on historical cycles, and hinted at future trends, all using clear, everyday language.
This clear overview turns complex data into insight you can trust. A solid grasp of the housing starts indicator can keep you ready for positive shifts in the market.
FAQ
What is the housing start indicator?
The housing start indicator tracks new residential construction projects initiated in a set period, offering a snapshot of market health and consumer confidence, which helps gauge economic trends.
What type of indicator are housing starts and building permits?
Housing starts and building permits serve as leading economic benchmarks, reflecting both construction activity and investor sentiment, which signal overall market trends in the residential sector.
What is the forecast for U.S. housing starts?
The forecast for U.S. housing starts is based on recent trends and data analyses, guiding expectations about future construction volumes that influence overall market conditions and economic outlook.
What qualifies as a housing start?
A housing start is recognized when new residential construction, whether a single-family home or multifamily unit, commences actual building work, marking the beginning of the project phase.
How can I access housing starts data by state, year, or chart sources like FRED?
Tracking housing starts through charts or state-specific data, including platforms like FRED, provides investors with detailed visual insights that support analysis of residential build trends over time.