
Ever notice how just a few people seem to hold most of the world's riches? When you take a closer look at global wealth, it feels like history is repeating itself, with today's numbers mirroring those of a hundred years ago.
It’s like a giant pie where almost everyone gets just a tiny slice while a small group grabs the biggest portions. Looking at these clear trends makes us stop and ask, are things really balanced?
This chat breaks down the numbers and shows how wealth and income are split across the globe, inviting us to rethink what we know about money in today’s world.
Key Figures and Trends in Worldwide Wealth Distribution
Global income and wealth inequality have changed a lot since 1980. Some people even say that today's numbers are similar to those from the early 1900s. In short, the rich keep getting richer while most people receive a smaller piece of the pie. Imagine a pizza that used to be shared equally but now only a few folks get the biggest slices.
From 1980 to 2020, the top 10% of earners in both developed and emerging economies have seen their share of income jump. This big change shows that wealth is concentrating in the hands of a few and highlights that only a small group benefits most from economic growth. Experts point to this trend as a clear sign of the growing wealth gap around the world.
One major driver of this trend is the shift from earning through work to making money from owning assets. Big companies are getting richer thanks to market control and smart investments, pulling income away from regular wages and into profits. Think of it as moving from a regular paycheck to earning from ownership stakes. And with digital technology and automation on the rise, this shift only makes the wealth gap even larger.
Regional Variations in Worldwide Wealth Distribution
When we peek at how wealth is split around the world, it’s clear that not everyone holds the same share of income. Different rules and government choices shape how wealth is divided. And when you compare these numbers, you start to see why some places have money spread out more evenly while others see a lot of wealth in just a few hands.
Take a look at this table:
| Country/Region | Top 10% Wealth Share (%) |
|---|---|
| European Union (aggregate) | 59.3 |
| Germany | 58.5 |
| Hungary | 67.1 |
| Netherlands | 45.4 |
| Iceland | 56.5 |
| North Macedonia | 56.7 |
This side-by-side comparison shows how local policies and market conditions shape who ends up with what. In some emerging economies, the pattern is totally different from advanced markets. It really makes you think about how money gaps can get wider or narrower depending on things like available capital and efforts to redistribute income.
Have you ever wondered how a small tweak in policy might spread money more fairly? By comparing these regional trends, we see not just numbers, but the real impact on people’s lives and the overall economic health of a society.
Historical Trends in Worldwide Wealth Distribution
Early in the century, the gap between the rich and the poor was enormous, almost like what we saw back in the early 1900s. Only a handful of people held most of the wealth, and the kind of policies that help share wealth were nearly unheard of. This laid a strong foundation for a deep divide in how assets and capital were owned.
After World War II, many countries put real effort into creating social safety nets and setting up tax and transfer policies. These efforts did help level things out for a short while, easing the differences in income and assets. It felt like governments and social programs were working together to spread wealth a bit more evenly.
Then, by the late 20th century, things took a sharp turn. With more economic freedom and less government control, the wealth gap started growing again. For example, data from the UK shows that the top earners captured a much larger share of wealth as older policies lost their effect. Modern trends now look a lot like those earlier patterns, with income from investments and financial rents pushing inequality higher across the board.
Drivers Behind Worldwide Wealth Distribution Patterns

Right now, shifts in the market and fresh tech trends are really changing how wealth moves around the globe. Fast tech progress, big players owning more, and uneven government policies mean that who gets rich and who doesn’t is changing a lot.
Technological Transformation
New machines and smarter software are changing the way people work. Instead of doing the same old tasks, many jobs now need high-tech skills. Think about it: rather than putting parts together on a factory line, many companies rely on automated systems managed by experts. This switch makes work faster and more efficient, but it also means that only a few well-paid tech jobs fill the gap, while many regular jobs are left behind.
Capital vs. Labor Income
These days, more of our money is coming from owning things, like stocks or dividends, than from a regular paycheck. Big companies are seeing their profits soar, and that makes owning assets even more valuable. It’s a bit like having a secret advantage; if you own something that earns money, you can get richer quicker than someone who only earns a wage. This trend leaves many wondering if traditional jobs will ever catch up.
Policy and Redistribution
Government policies haven’t kept up with how fast things are changing. Tax rules and social benefits often seem patchy, falling short of balancing the big differences in who earns what. Even when new rules are made to share money more fairly, they usually miss the mark because the market is moving much faster. As a result, the gap between those earning from capital and routine wages just seems to keep growing.
Measuring Worldwide Wealth Distribution: Metrics and Indices
Finding out who really holds the wealth in a country starts with clear, solid numbers. Experts look at common measures to see how money is shared out before and after taxes. Think of these numbers as a financial thermometer – they help us feel out the true state of income and asset distribution in real time. By checking details like market income, the money you actually keep to spend, and what ends up in your pocket after all is said and done, we get a clear picture of economic inequality.
- Gini coefficient – This tool scores inequality on a scale from 0 (everyone’s equal) to 1 (one person is way ahead). Imagine a classroom where nearly everyone scores the same on a test.
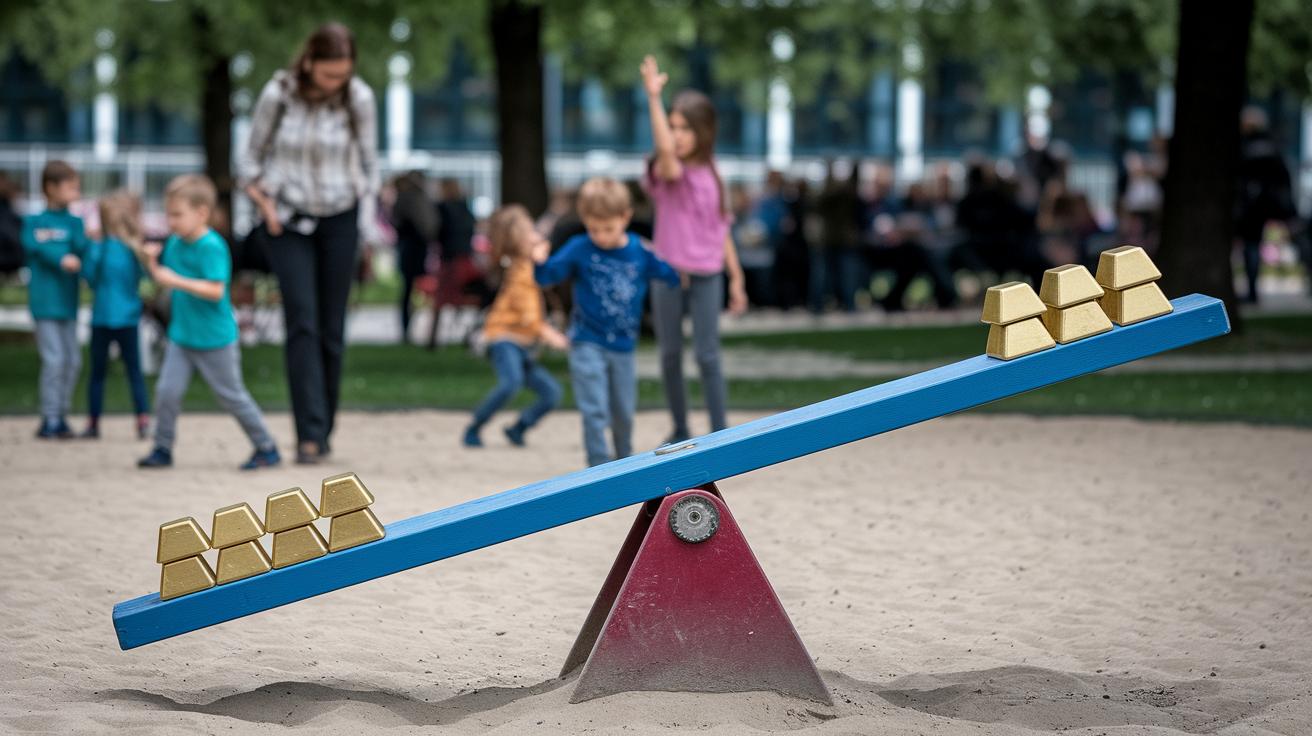
- Palma ratio – This measure zeroes in on the gap between the top 10% and the bottom 40%. Picture a seesaw that tips so much on one side that the other barely moves.
- Top 1% wealth share – This shows just how much of a country’s wealth is held by the richest one percent. Think of a huge pie where one tiny slice gets nearly all the filling.
- Intergenerational earnings elasticity – This indicator looks at how much a child’s future earnings mirror their parents’ income. It’s like noticing that kids often follow the same path as their parents financially.
Implications and Future Outlook for Worldwide Wealth Distribution
The COVID-19 pandemic really changed the game. Households with valuable assets seem to have caught a major boost, almost like they hopped on a fast train while others were waiting on the platform. Asset prices soared even as job growth slowed down, leaving many salary earners wondering how one global shock could tip the scales so dramatically.
This imbalance might bring long-term trouble if it goes unchecked. Picture a seesaw where one end is so heavy it shakes the whole foundation of social trust and unity. With wealth gathering in the hands of a tiny elite, our democratic systems and social bonds might start to waver, creating more tension and uncertainty.
Experts are suggesting that smart shifts in policy, such as progressive taxes and targeted social spending, could help rebalance things. Imagine rebalancing a wobbly scale with thoughtful measures that ease social divides and bring people closer together. These strategies might just be the key to making wealth distribution fairer over time.
Final Words
In the action, we reviewed key trends, from a rising share of capital income to varying regional wealth spreads. We explored historical shifts, the impact of digital transformation, and how current policies shape our financial future.
We looked at standardized measures that paint an honest picture of global wealth distribution. The insights guide us toward proactive strategies and smart decision-making for a brighter economic outlook. Here's to embracing clarity and hope in the ever-changing financial world.
FAQ
How is global wealth distributed by country and year?
Global wealth distribution by country and year shows that developed nations concentrate more wealth among top percentiles, while emerging economies experience sharp rises in wealth gaps over time.
What is the global wealth distribution in 2022 and what examples illustrate it?
The global wealth distribution in 2022 highlights stark contrasts, where top households hold a bulk of assets; examples reveal differences between advanced market concentrations and rapid changes in emerging economies.
How do race and gender impact global wealth distribution?
Global wealth distribution by race and gender reveals systemic disparities that result in minorities and women accumulating less wealth than their counterparts, reflecting historical and structural imbalances.
Who owns most of the world’s wealth and what does the top 1% control?
Who owns most of the world’s wealth is seen in the top 1%, which controls a vast share of accumulated assets, underscoring a significant concentration that fuels economic imbalance.
What is the significance of the top 5% wealth net worth in the US?
The top 5% wealth net worth in the US illustrates that these households possess markedly higher asset values and income levels, setting them apart and highlighting pronounced domestic economic disparities.
What can global inequality graphs and indices tell us about wealth distribution?
Global inequality graphs and indices provide clear visual and quantitative measures of how wealth is concentrated, helping observers understand the widening gap between the richest segments and the rest of society.