
At the time this article was written, Ethereum’s price attempted to climb on its daily chart. ETH price has risen by 2% in the past 24 hours. However, there have been no significant price movements.
The Ethereum price dropped 21% in the past week. The technical indicators indicated that bearishness would continue.
The Ethereum price has moved closer to the support level due to a significant drop in buying strength.
Ethereum may see a decline in its daily chart if buyers fail to defend the nearest support line.
To invalidate the bearish thesis, ETH must jump past multiple resistances. The altcoin can be further pushed down by selling dominance.
Most altcoins are following the lead of Bitcoin, a major market player.
To invalidate the bearish thesis, ETH must move above the $2000 level. ETH bulls need to protect the $1,200 price range or else ETH will fall to the $1,000 level.
Ethereum Price Analysis: A Day Chart
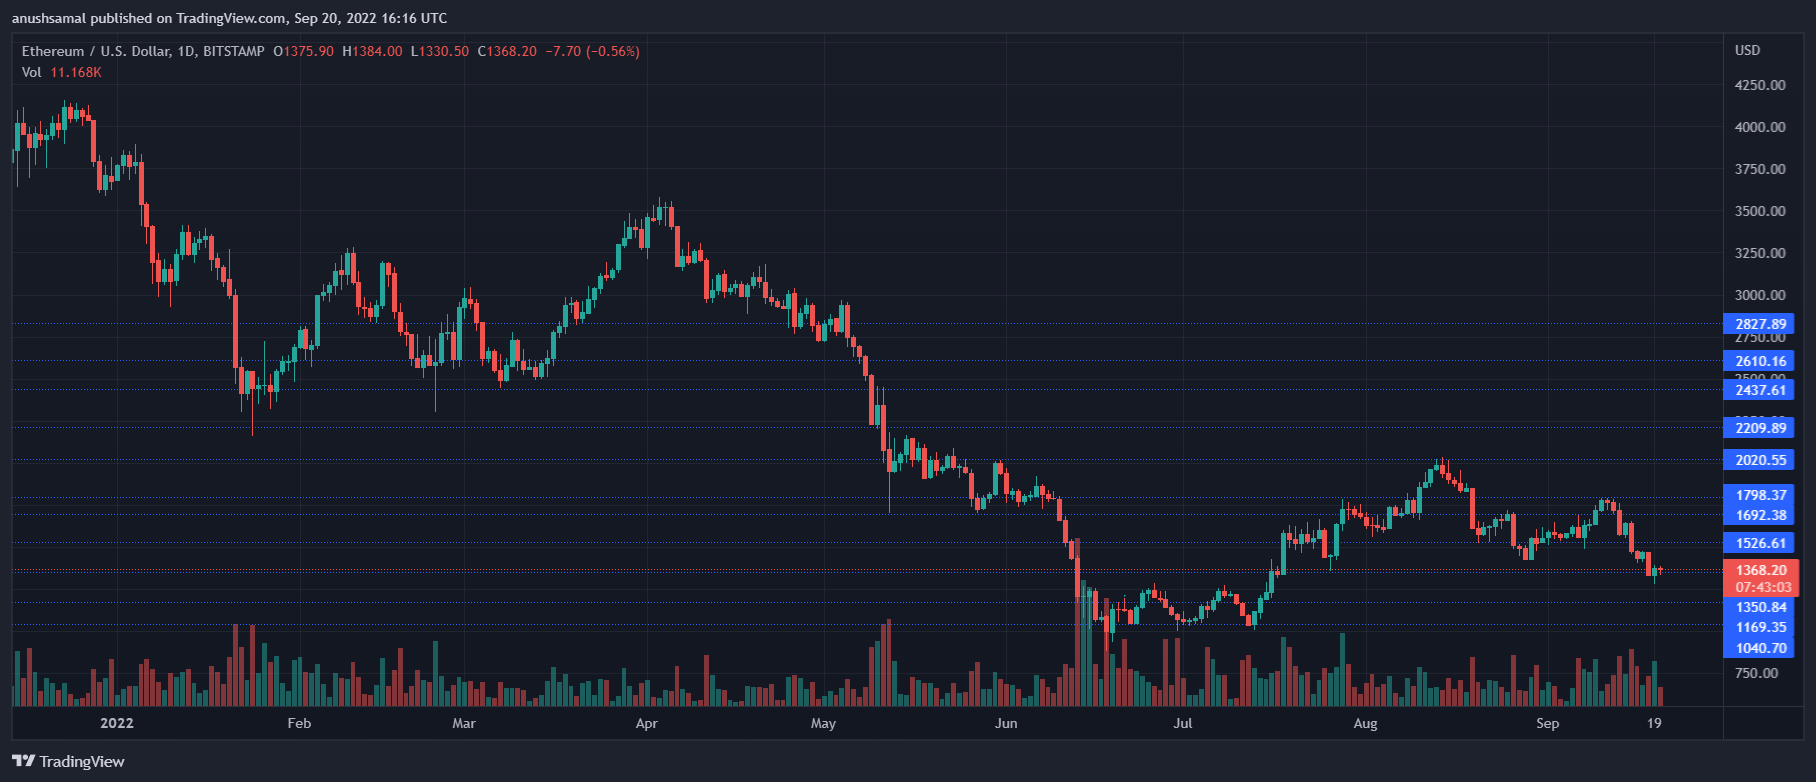
The price of Ethereum was $1,360 as of the writing. Since Ethereum crossed $1,800, the bulls couldn’t sustain themselves, and the asset tumbled further.
At $1,200 the closest support level for the coin was reached. Because ETH could fall below $1,000, it is vital that demand for the coin rises.
Altcoin resistance was seen at $1.560. Above that, there might be a price ceiling of $1.800. The bearish thesis may be invalidated if ETH breaks through $2,000
Ethereum prices declined in the past session, signaling an increase in selling pressure.
Technical Analysis
ETH continues to slide south due to a shortage of demand at the writing of this article. The chart also shows bearishness from indicators.
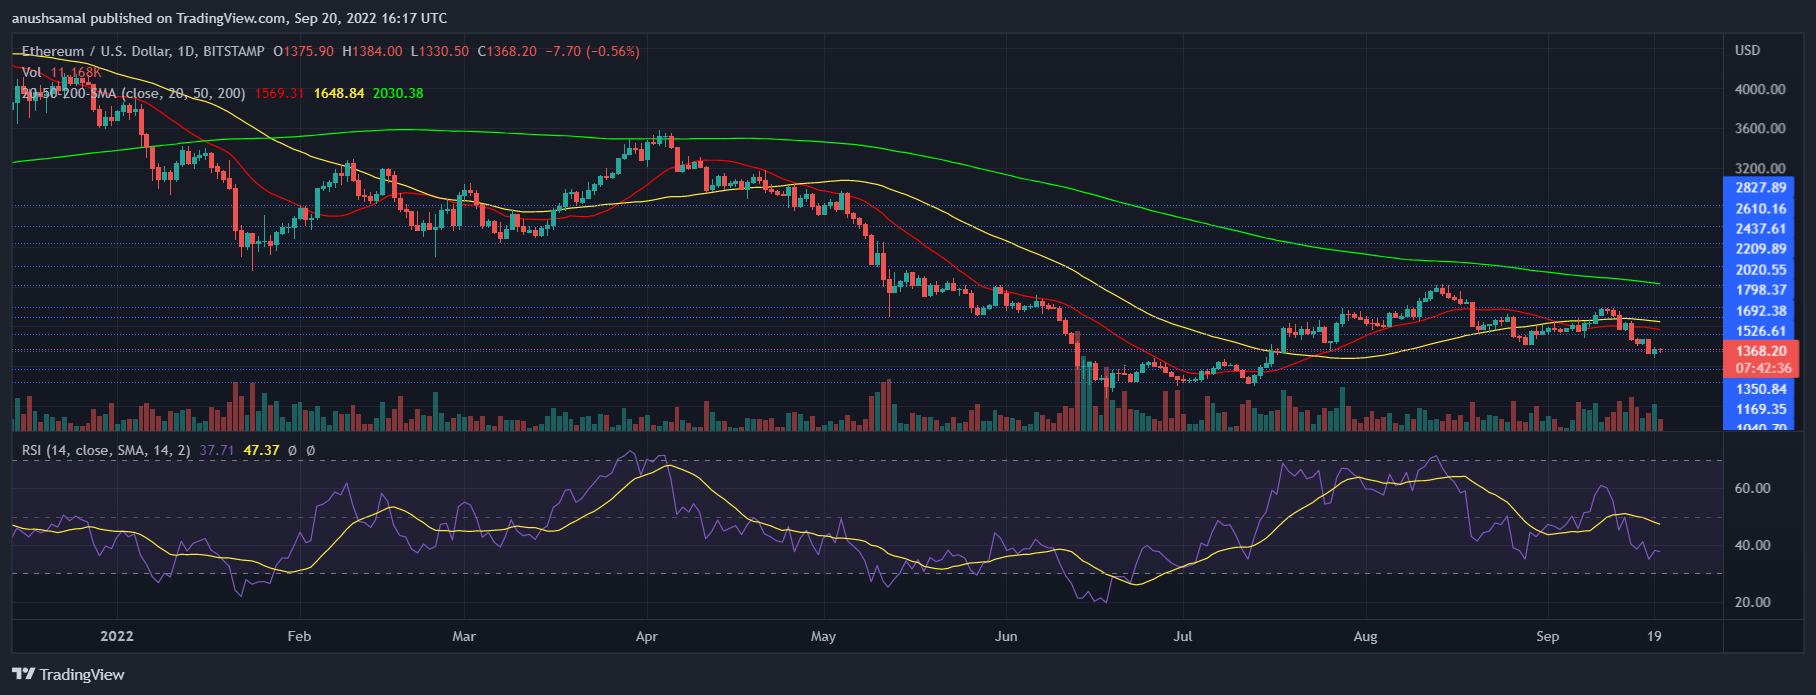
Relative Strength Index was shown below the halfway line, which meant that there was more selling pressure than buying power in the market.
It was a sign that Ethereum has been in lower demand since the writing of this post.
Due to falling demand, Ethereum’s price fell below its 20-SMA. The market’s price momentum was being driven by sellers.
At press time the altcoin displayed a sell signal, which indicated that further bearishness could occur.
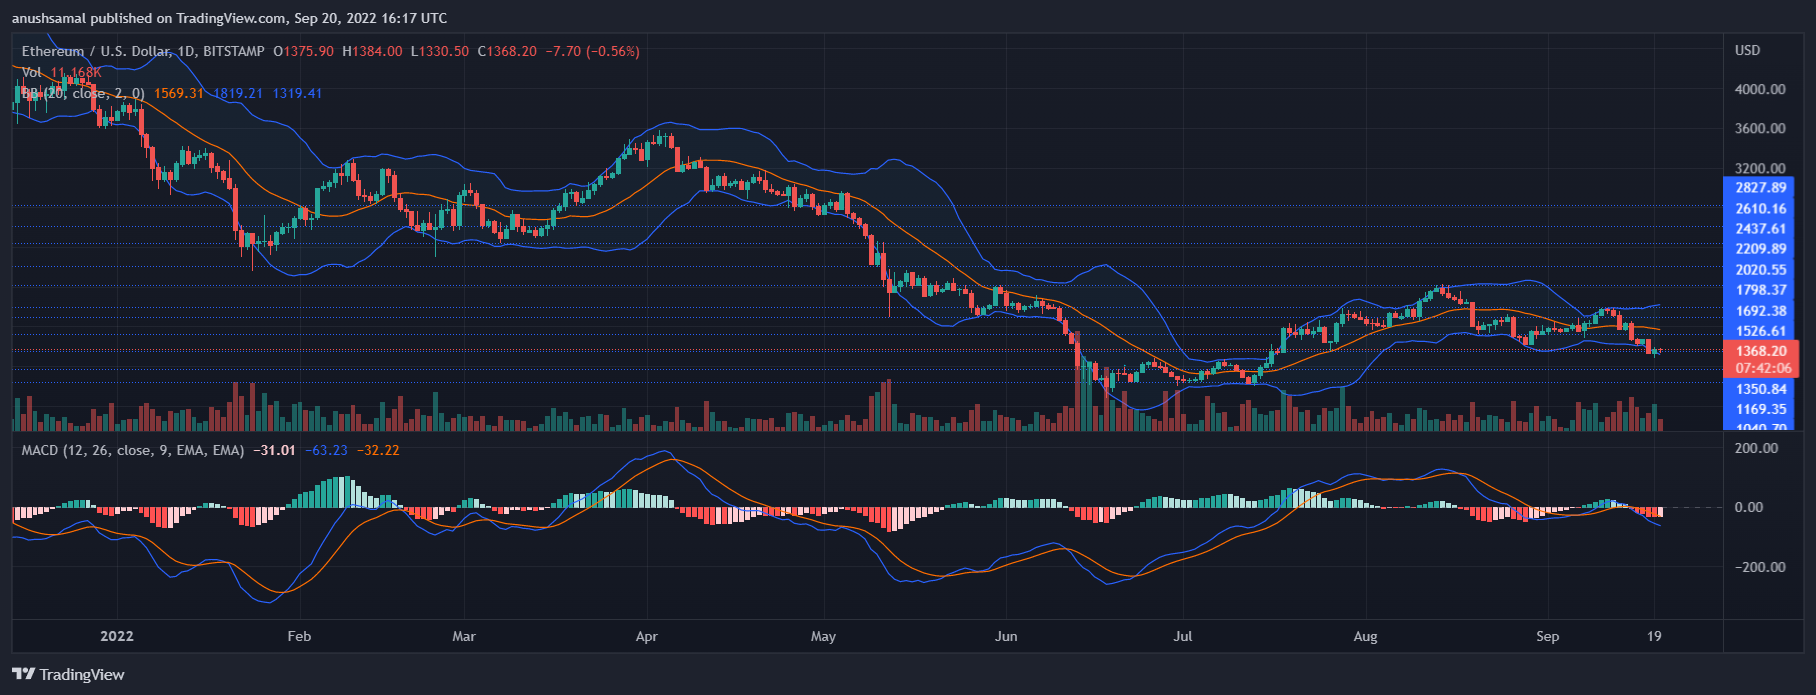
Moving Average Convergence Divergence (MACD) displays market direction and price momentum. It then experienced a bearish crossover that led to red signal bars. This signal is a sell signal for ETH.
Bollinger Bands, which indicate volatility or fluctuation in price, also indicated an upcoming price change when the bands widened as press time.