
Historic data on the Bitcoin volatility indicator suggests that crypto prices could see a major move in the future.
Bitcoin Volatility Index Recently Has Been Below 25
An economist pointed this out. TwitterThe volatility index is now in a lower zone than it was previously, which has been the scene of a dramatic move in BTC.
The “volatility index” in question is the BitMEX .BVOL index, and according to the exchange, the metric’s value “is the rolling 30 day annualized volatility of the daily 11:30 UTC to 12:00 UTC Time Weighted Average Price (TWAP) of Bitcoin / USD.”
This calculates the Time Weighted Average Prices using measurements taken at 1-minute intervals during a time period of one-half-an-hour.
The index measures how far BTC’s recent price deviation from the average and, more importantly, its volatility in recent times.
The high values indicate that the crypto market has made some significant moves in recent months, while the low numbers suggest a stagnant market.
Now, below is a chart that shows how the Bitcoin volatility index’s value has changed during the last few years:
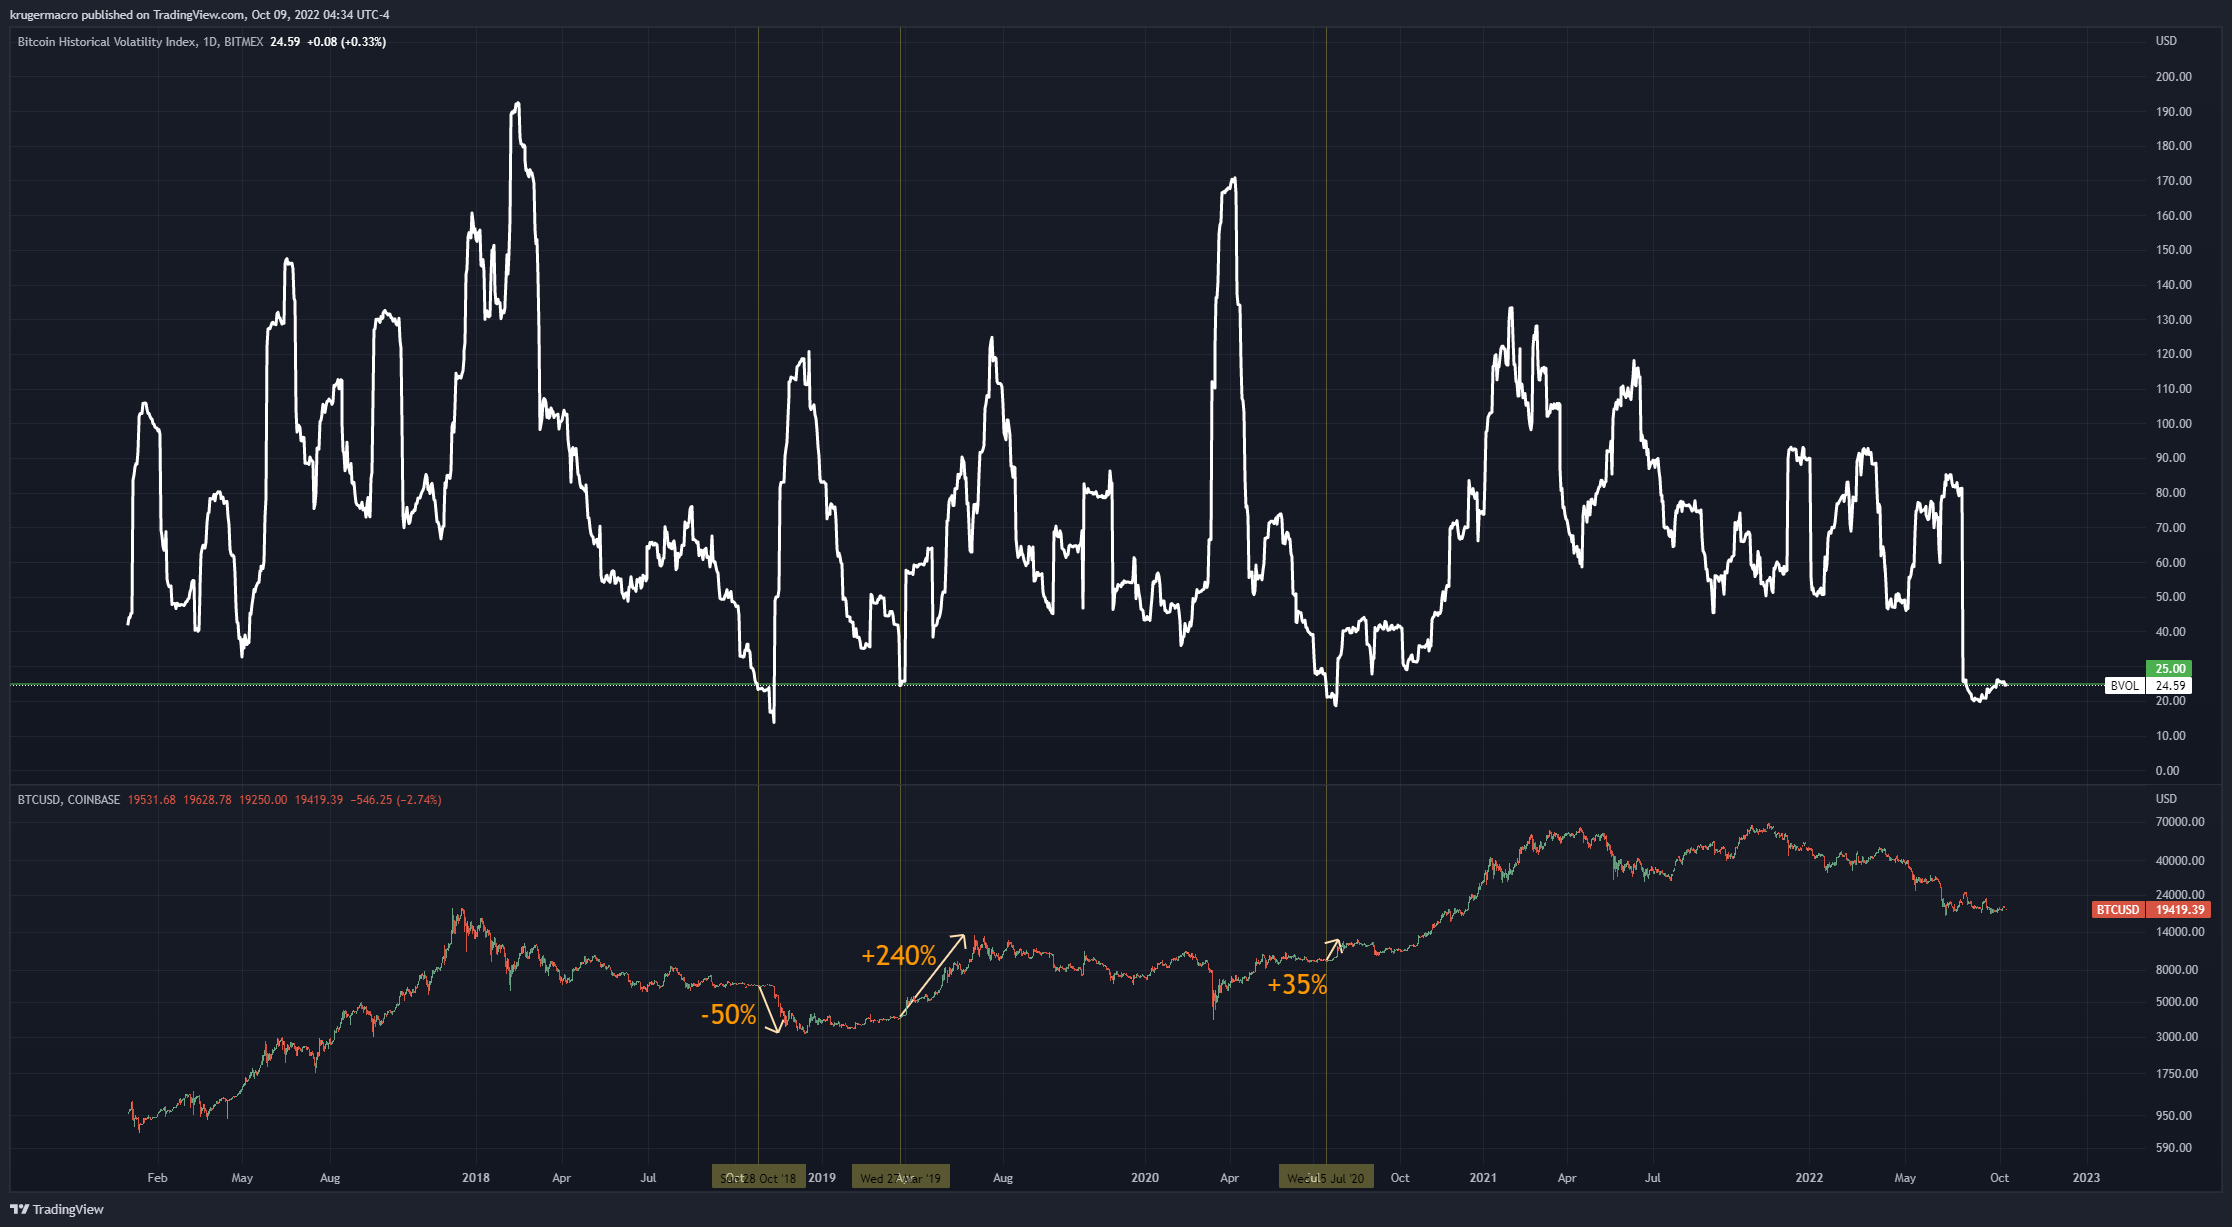
Source:| Source: Alex Krüger on Twitter
The graph shows that the analyst marked the relevant trends between the Bitcoin volatility indicator and the cryptocurrency price.
It looks like whenever the indicator has dipped below a value of 25, and then subsequently bottomed below the level, the BTC price has seen some significant moves that have made the metric’s value shoot right up.
This trend has been seen in three cases over the years. The first two were bullish moves by the price, the third was a crash.
From the chart, it’s apparent that the Bitcoin volatility index has once again dropped down into this historical zone as the current BVOL value stands at around 24.59.
The crypto market could see another significant move soon if it follows the same trends as in the past.
BTC Prices
At the time of writing, Bitcoin’s price floats around $19.4k, up 1% in the last seven days. The crypto’s value has fallen 9% over the last month.
The chart below shows how the currency’s price has changed over the course of five days.

Source: BTCUSD on TradingView| Source: BTCUSD on TradingView
Featured image by Kanchanara at Unsplash.com. Charts from TradingView.com