
The Bitcoin MVRV triple-ribbon signal has formed again, according to data from on-chain. This has resulted in an average decline of 30% compared with previous years.
Bitcoin MVRV Triple Ribbon – Bearish Signal Formation
An analyst pointed out in CryptoQuant that the recent trend in BTC MVRV Triple Ribbon may indicate that the crypto market will experience another drawdown.
Before looking at what “MVRV” is, it’s best to first take a look at the two major types of capitalization methods for Bitcoin.
The first cap, the usual market cap, is calculated by multiplying each coin in circulation with the current BTC price (or more simply, it’s just the total number of coins in circulation, multiplied by the price).
Where the other capitalization model, the “realized cap” differs is that instead of all the coins being weighted against the latest value of the crypto, each coin is multiplied by the BTC price that was there at the time of the coin’s last movement.
The MVRV ratio is simply the difference between these two Bitcoin caps. It’s market divided by realized. This is a historical indicator of when BTC’s value has been low or high.
Below is a chart showing the trends in MVRV moving averages (ten-day and fifteen-day), over the past few months.
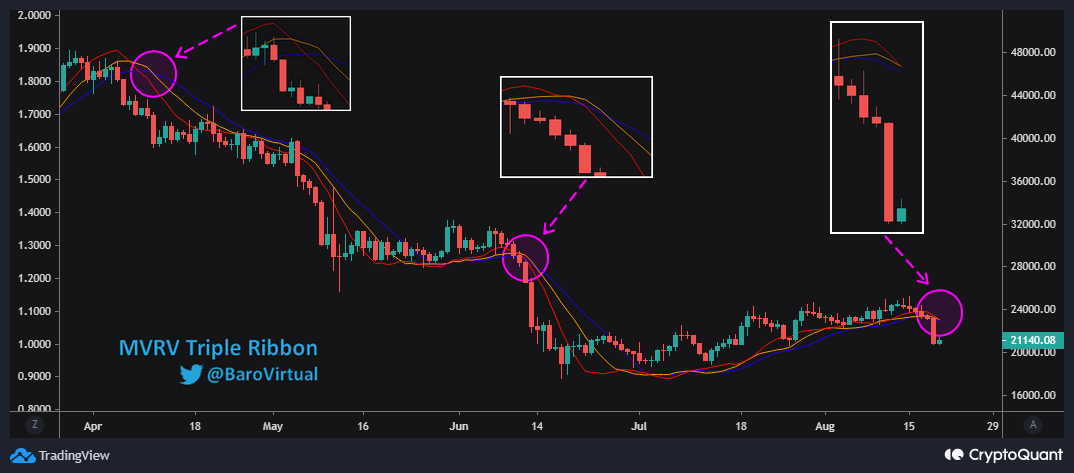
Source: CryptoQuant| Source: CryptoQuant
These three moving averages of the indicator together form the “MVRV triple ribbon.” And as you can see in the above graph, the trend in this triple ribbon has had some interesting implications on the Bitcoin price during the last few months.
The crypto price has seen a steep decline in the short term whenever the 10-day MA is below the MAs of the other MAs.
Each of the MVRV triple-ribbon crossovers have resulted, on average, in a 30% drawdown of BTC’s value.
From the chart, it’s apparent that this pattern once again seems to be forming for the indicator. Bitcoin could see more falls in the future if this signal is the same as previous ones.
BTC price
At the time of writing, Bitcoin’s price floats around $21.2k, down 12% in the past week. The crypto’s value has dropped 9% over the past month.
Below is a chart showing the trends in coin price over the last five days.

It seems that the value of crypto has fallen a bit in recent days | Source: BTCUSD on TradingView
The featured image is by Thomas Bonometti at Unsplash.com. Also charts from TradingView.com. CryptoQuant.com.