The Bitcoin MVRV has fallen below 1 recently, indicating that the average Bitcoin holder is now in a loss state.
Bitcoin MVRV is Back in the Historical Bottom Region
As pointed out by a post on CryptoQuant, the BTC MVRV ratio has now come down into the region below “one” once again.
The “Market Value to Realized Value” (or MVRV in short) ratio is an indicator that’s calculated by dividing the market cap of Bitcoin with its realized cap.
The “realized cap” measures the cap of BTC by weighting each coin in circulation with the price at which it was last moved (unlike the market cap, where all the coins are weighted against the same latest BTC value).
The ratio greater than 1 means that average holders are in profit, and therefore have more incentive for selling in the markets. BTC could be too expensive right now if the ratio is especially high.
A metric value less than the threshold suggests that the entire market is experiencing a loss, as the realized capital is higher than the market. Investors are less likely to buy if their value drops.
Below is a chart that illustrates the Bitcoin MVRV trend over several years.
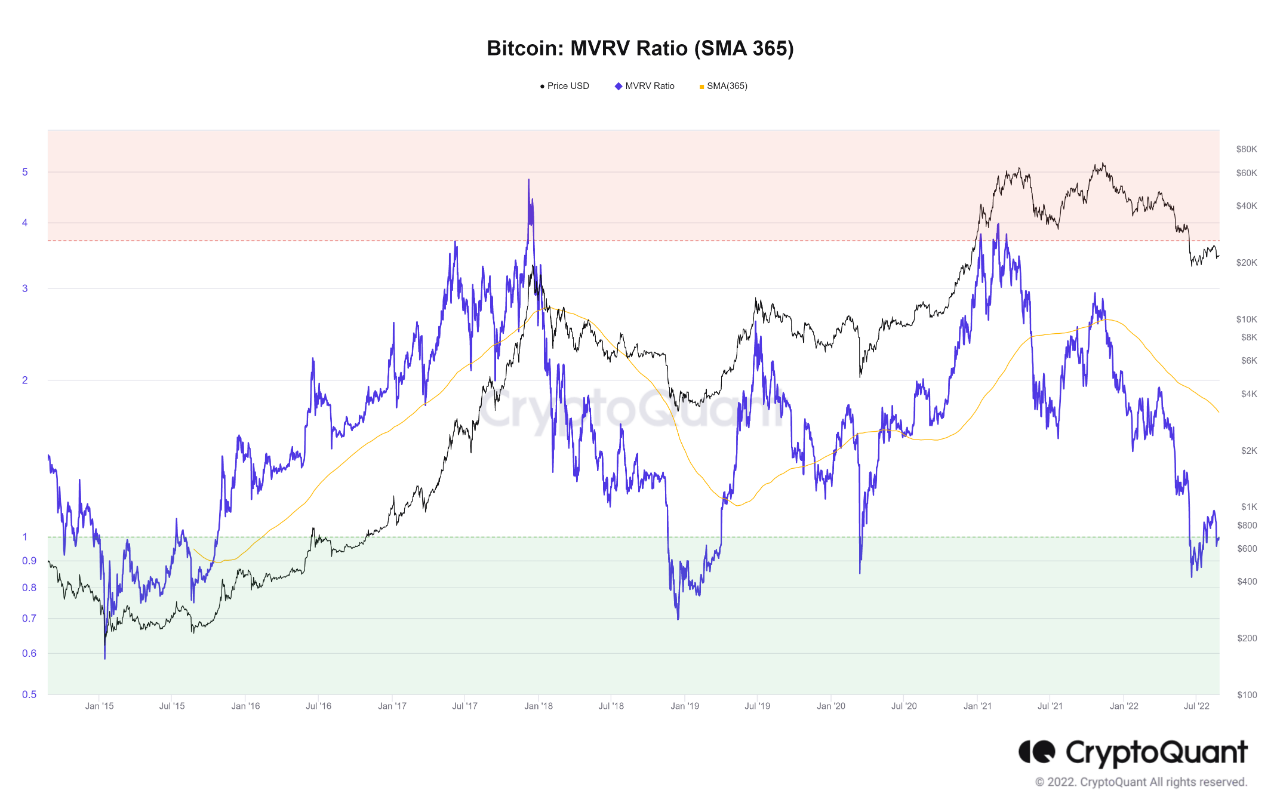
Source: CryptoQuant| Source: CryptoQuant
As you can see in the above graph, the Bitcoin MVRV ratio had earlier escaped above the “value=1” line, but after spending only some time above it, the metric has now once again plunged back into the zone.
This is the region where crypto bear market bottoms were formed in previous cycles. A break above the level has often been a sign of a new bull market.
People believed the recent indicator exiting this zone meant the bear was closing. However, since the indicator has declined back down, it’s possible the coin hasn’t left the bear market just yet. It’s unclear at the moment how long more will the crypto have to spend in this region.
BTC Prices
At the time of writing, Bitcoin’s price floats around $20.7k, down 3% in the past week. The crypto’s value has fallen 1% over the past month.

The BTC price seems to have stayed in consolidation over the last few days. Source: BTCUSD at TradingView| Source: BTCUSD on TradingView
Featured image from Zdeněk Macháček on Unsplash.com, charts from TradingView.com, CryptoQuant.com