
According to on-chain data, Bitcoin miners’ reserve has been growing due to miners accumulating BTC. The Puell Multiple confirms that miners don’t want to sell at the current price level.
Bitcoin Miner Reserves Reach Their Highest Value for The Year
CryptoQuant posted that BTC miners reserve is increasing as miners are waiting to sell.
Here are two relevant indicators. The first is the “miner reserve,” which is a metric that simply measures the amount of Bitcoin that miners are currently holding in their wallets.
A positive trend in this indicator means miners are investing their Bitcoins rather than trying to sell them. A downtrend of this indicator would indicate that miners may be selling their Bitcoin.
The other indicator is the famous “Puell Multiple,” a metric that tells us how profitable miners would be compared to the last year if they sold all their mined coins today.
The Puell Multiple’s value is calculated by taking the ratio between the daily value of issued coins and the 365-day moving average of it.
Read More: Bitcoin Bottom Sign From Bear Market. Black Thursday Could Save The Bull Run| Bitcoin Bottom Signal From Bear Market, Black Thursday Could Save The Bull Run
Here’s a chart showing the change in these BTC indicator values over the last few months.
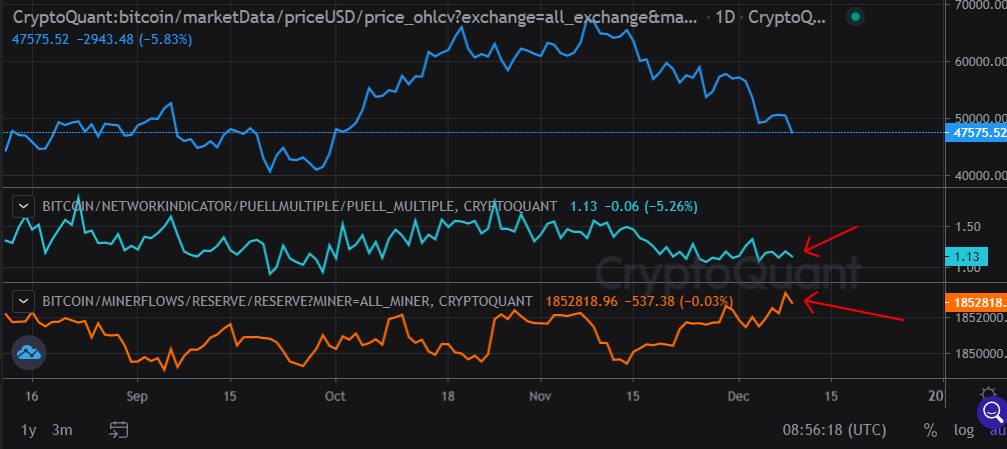
Source: CryptoQuant| Source: CryptoQuant
The graph above shows that the BTC miner reserves seem to be growing. This indicator has the highest value in the last year.
Similar Reading: Goldman Sachs CEO Sidesteps Bitcoin Inquiries and Says Blockchain is More Important| Goldman Sachs CEO Sidesteps Bitcoin Inquiries, Says Blockchain Is More Important
Also, the Puell Multiple’s value seems to be around 1.13. Such a low value indicates that miners aren’t finding it that profitable to sell at the current level. As miners hold on to their coins, this explains the current uptrend in miner reserve.
So, the Puell Multiple’s current value might mean that Bitcoin is undervalued at the moment. This trend could prove to be bullish for the coin’s price.
BTC price
At the time of writing, Bitcoin’s price floats around $49.7k, down 12% in the last seven days. The crypto’s value has fallen 26% over the last month.
The chart below shows how Bitcoin’s prices have changed over the course of the past five business days.

BTC seems to be moving sideways over the past few days. Source: BTCUSD at TradingView| Source: BTCUSD on TradingView
Bitcoin seems to have been stuck in consolidation since its crash, around a week before. Currently, it’s unclear when the crypto might break out of this rangebound market or which direction it will escape in.
Unsplash.com's featured image. Charts by TradingView.com. CryptoQuant.com chart.