According to on-chain data, the Bitcoin miner’s selling power was at its lowest point for the past year. This may be a favorable indicator for crypto prices.
Recently, Bitcoin Miner Sales Power is falling
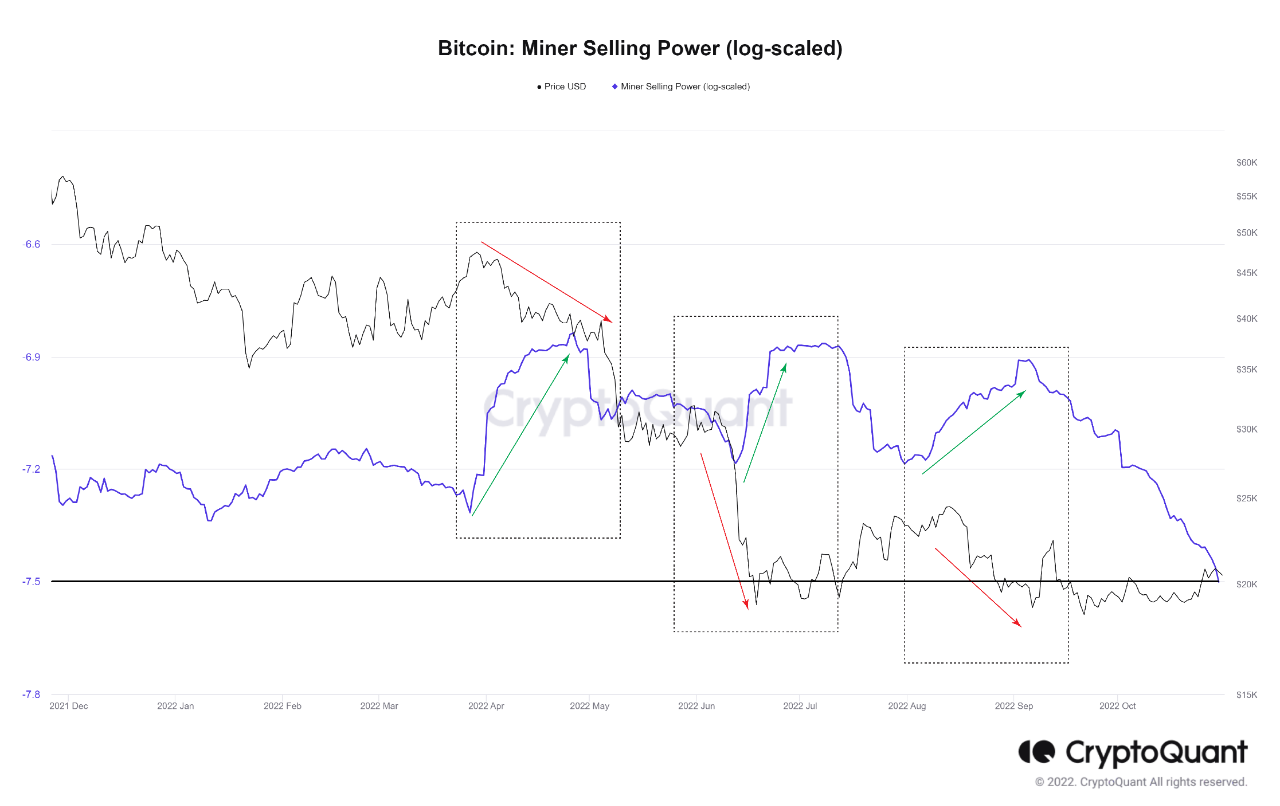
An analyst pointed out in a CryptoQuant posting that the metric saw a rise in its value several times this year and the BTC price had fallen each time.
The “miner selling power” is an indicator that’s defined as the ratio between the Bitcoin miner outflows and the total number of coins held by this cohort (30-day moving average, log-scaled)
Here, the “miner outflows” is a measure of the total amount of BTC that miners are transferring out of their personal wallets.
As miners withdraw more coins from their reserves, the price of their miner selling power increases. This means that they have an increased ability to sell their coins. This trend could be negative for crypto’s value.
On the other hand, low values of the indicator suggest miners aren’t putting much selling pressure on the market at the moment, and hence might prove to be bullish for the BTC price.
Below is a graph that illustrates the current trend of the Bitcoin miners selling power log-scaled over 2022.

Source: CryptoQuant| Source: CryptoQuant
You can clearly see that quant highlighted the important points for Bitcoin mining power selling.
The indicator seems to have seen three periods of rapid growth in the last year. At the same time, the cryptocurrency price has suffered.
In the last few weeks, the metric has been on a constant decline, suggesting that miners haven’t been selling much during the period.
This downtrend has caused the Bitcoin miner’s selling power to drop to its lowest level in the past year. This could indicate a positive trend for the cryptocurrency’s current rally, based on the trends.
BTC price
At the time of writing, Bitcoin’s price floats around $20.5k, up 6% in the last week. The crypto gained 5% over the last month.
Below is a chart showing the change in coin price over the past five days.

Source: BTCUSD on TradingView| Source: BTCUSD on TradingView
Featured Image by Brian Wangenheim, Unsplash.com. Charts from TradingView.com and CryptoQuant.com.