
Glassnode data suggests that Bitcoin is in the historic bear market to bull markets transition period.
Recently, the Bitcoin Price-Supply Relationship in Profit has fallen to 0.75
Glassnode recently reported that the BTC correlation between price and supply of profit is generally lower than 0.75 in transitional periods.
The “supply in profit” is an indicator that measures the percentage of the total Bitcoin supply that’s holding some profit right now.
To calculate the metric, we look at each coin’s on-chain history to find out its most recent price. The current BTC price for any coin that has a lower selling price than its present value is a sign that the coin may have unrealized profit.
The correlation between the crypto’s price and its supply in profit tells us whether the two metrics have been moving in the same direction or not.
This chart shows how the Bitcoin correlation has changed over time.
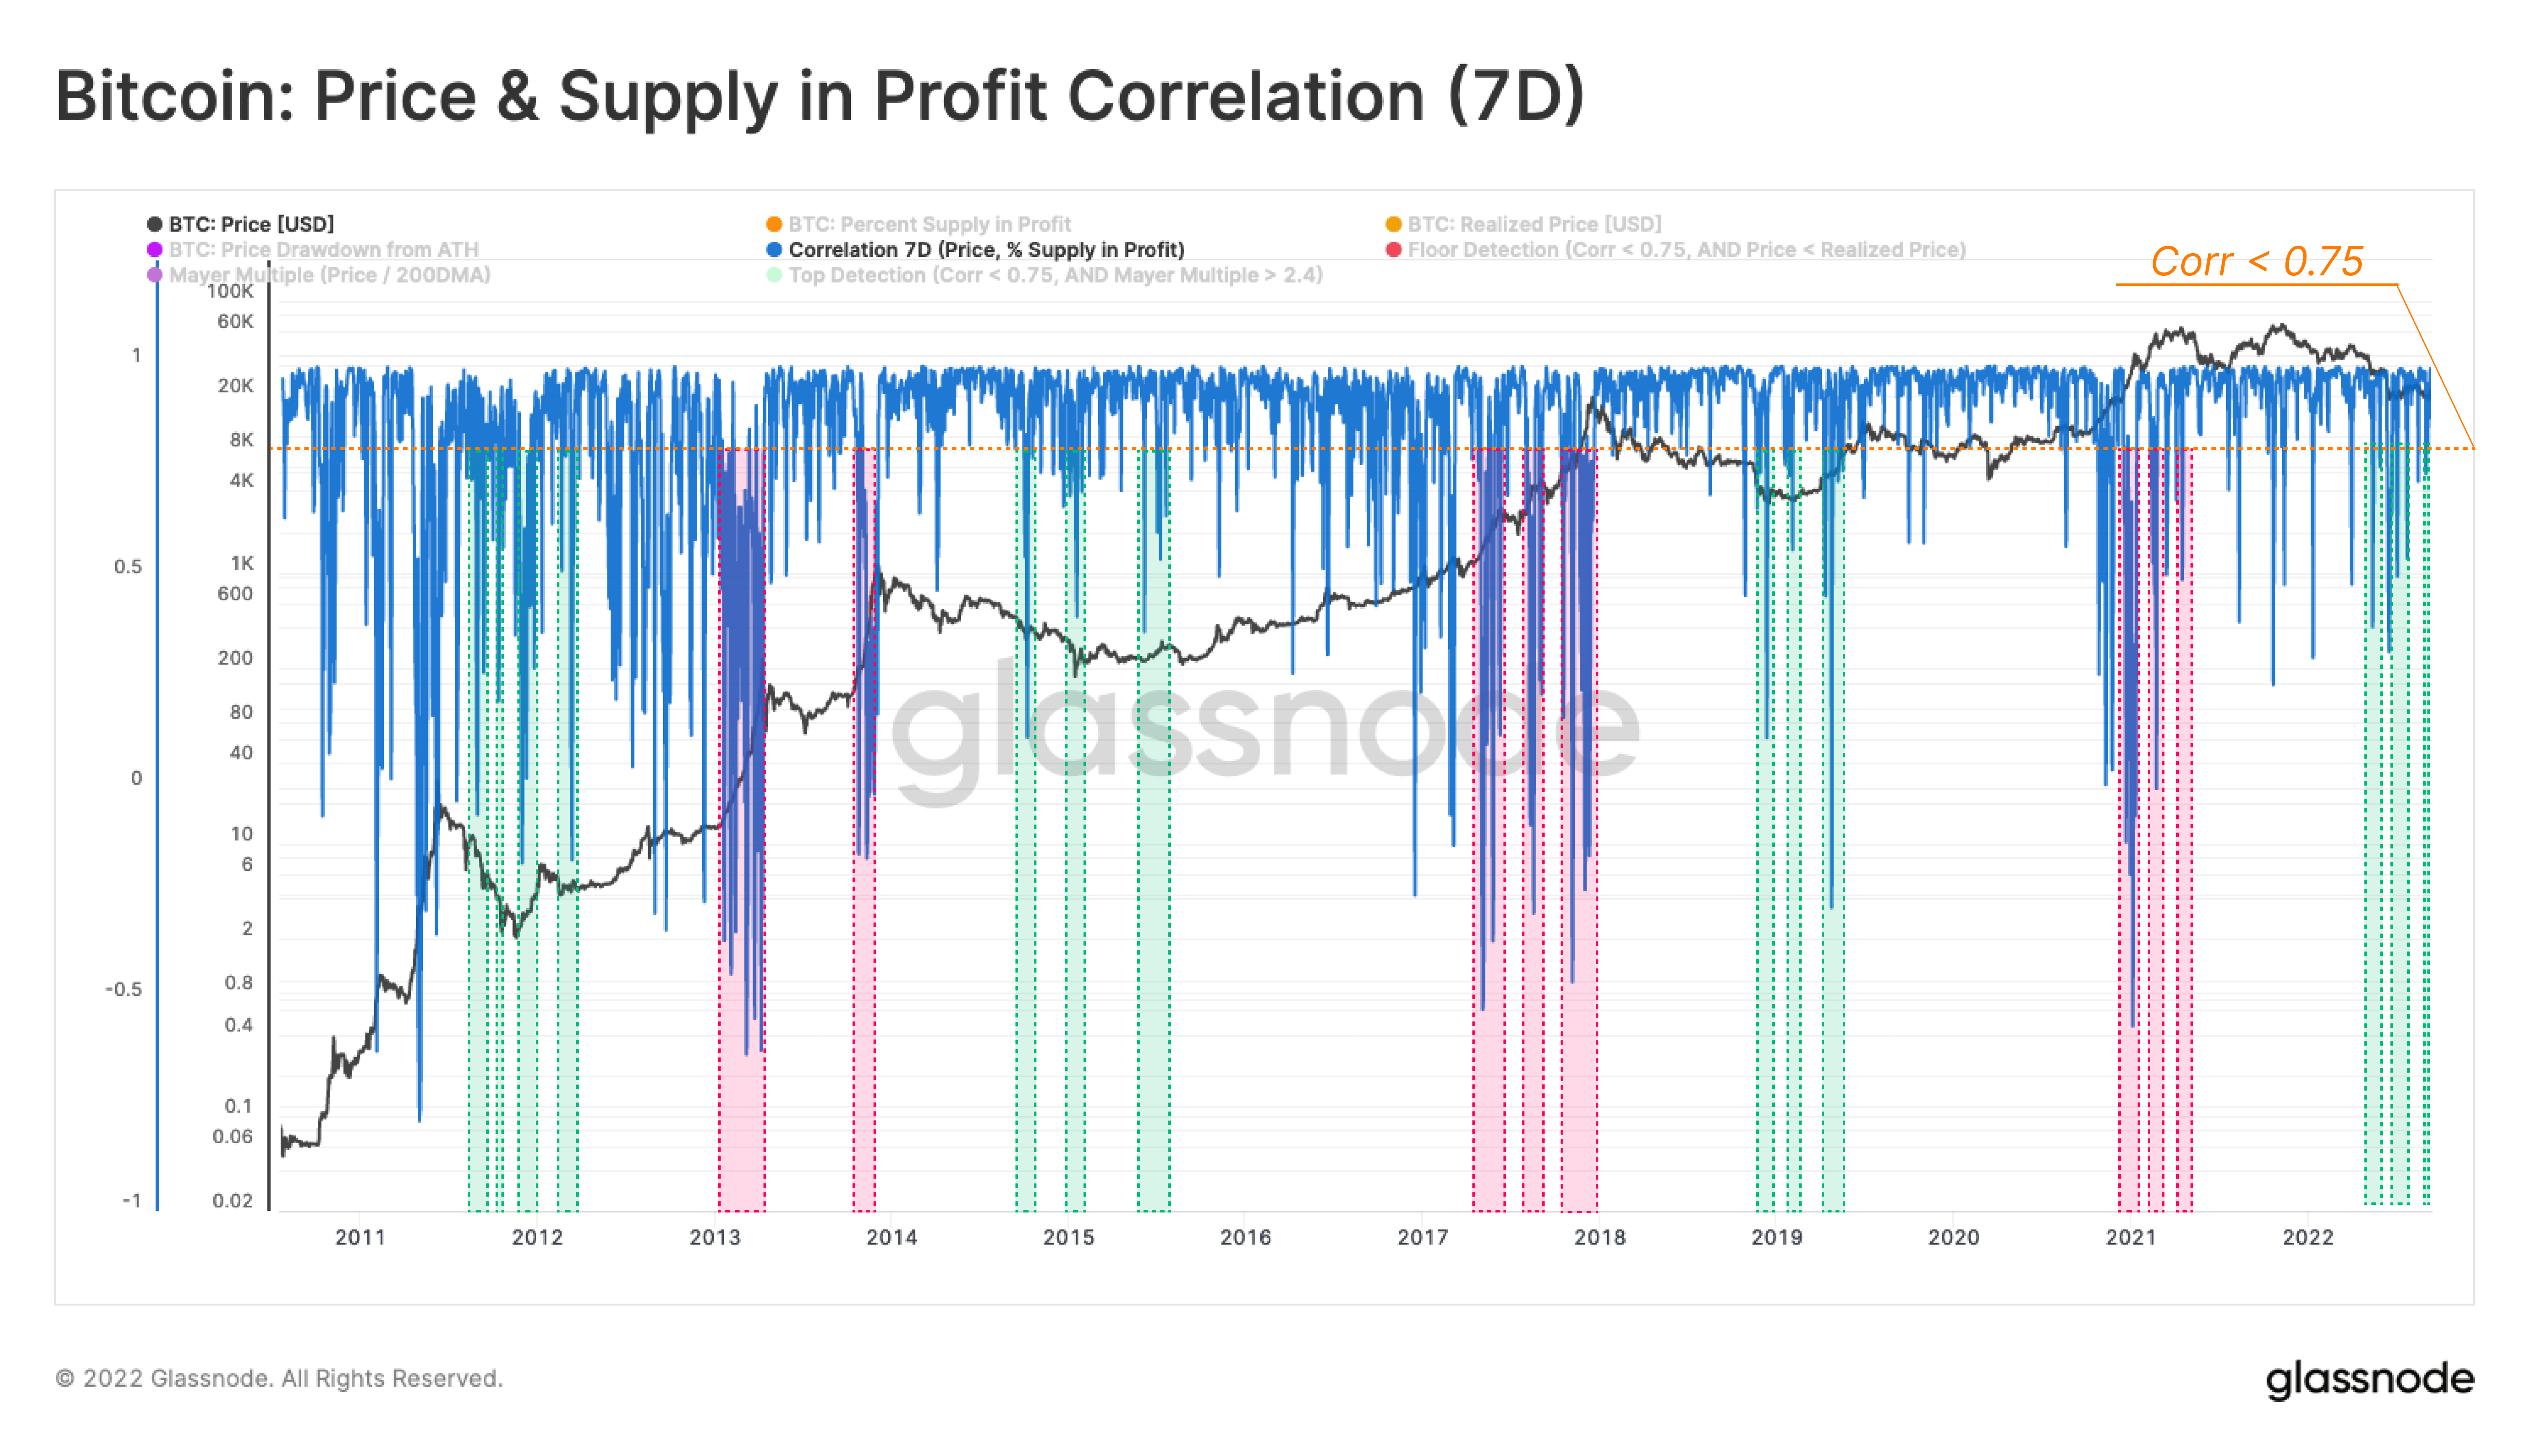
Multiple times recently, the metric's value has fallen to a low level. Source: Glassnode’s Market Pulse| Source: Glassnode's Market Pulse
Positive correlations mean that the profit and price are moving in the same direction. Conversely, negative correlations mean they are heading in the opposite direction.
You can see that Bitcoin values were above 0.9 in each of its previous price cycles.
However, it is more common for the indicator to drop below 0.75 in periods of transition from bull markets to bear markets as well as vice-versa.
These deviations are seen in bear to bull market transitions. This is because sellers become exhausted in late bear markets, while investors who remain frustrated with their investments tend to be reluctant to transfer funds. Thus, decreasing price-supply correlation.
During the other transitions, profit supply generally rises to nearly 100% as the price increases to a new ATH. This decreases any correlation between the price and the profit.
Recent plunges have been observed below the threshold of 0.75, indicating that Bitcoin may be in the historic bear-to-bull transition zone.
BTC price
At the time of writing, Bitcoin’s price floats around $19.1k, down 4% in the last seven days. In the past month, crypto lost 10%.
Below is a chart showing the BTC price trend over the past five days.

It seems like crypto's value has not moved much in recent days. Source: TradingView, BTCUSD.| Source: BTCUSD on TradingView
Featured image by Kanchanara at Unsplash.com. Also charts from TradingView.com. Glassnode.com.