Tron’s native coin TRX has been moving on bullish price action since the beginning of the month. Tron has announced over the last weeks that its algorithmic stable currency USDD will be live soon. Since then, TRX has seen a surge in anticipation.
TRX has been a top-earning coin in the market. This bullish attitude has seen the coin move past the immediate price limit and push it to the next resistance level. The chart shows that the coin trades within a triangle pattern based on its trading history over the past months.
The trading triangle pattern highlights ascending support lines as well as descending price ceilings. TRX’s prices have shot up but even in the middle of last month, the coin was seen trading close to its crucial support level. The chart showed the prices of the coin slightly declining due to profit taking.
Tron Price Analysis: One Day Chart
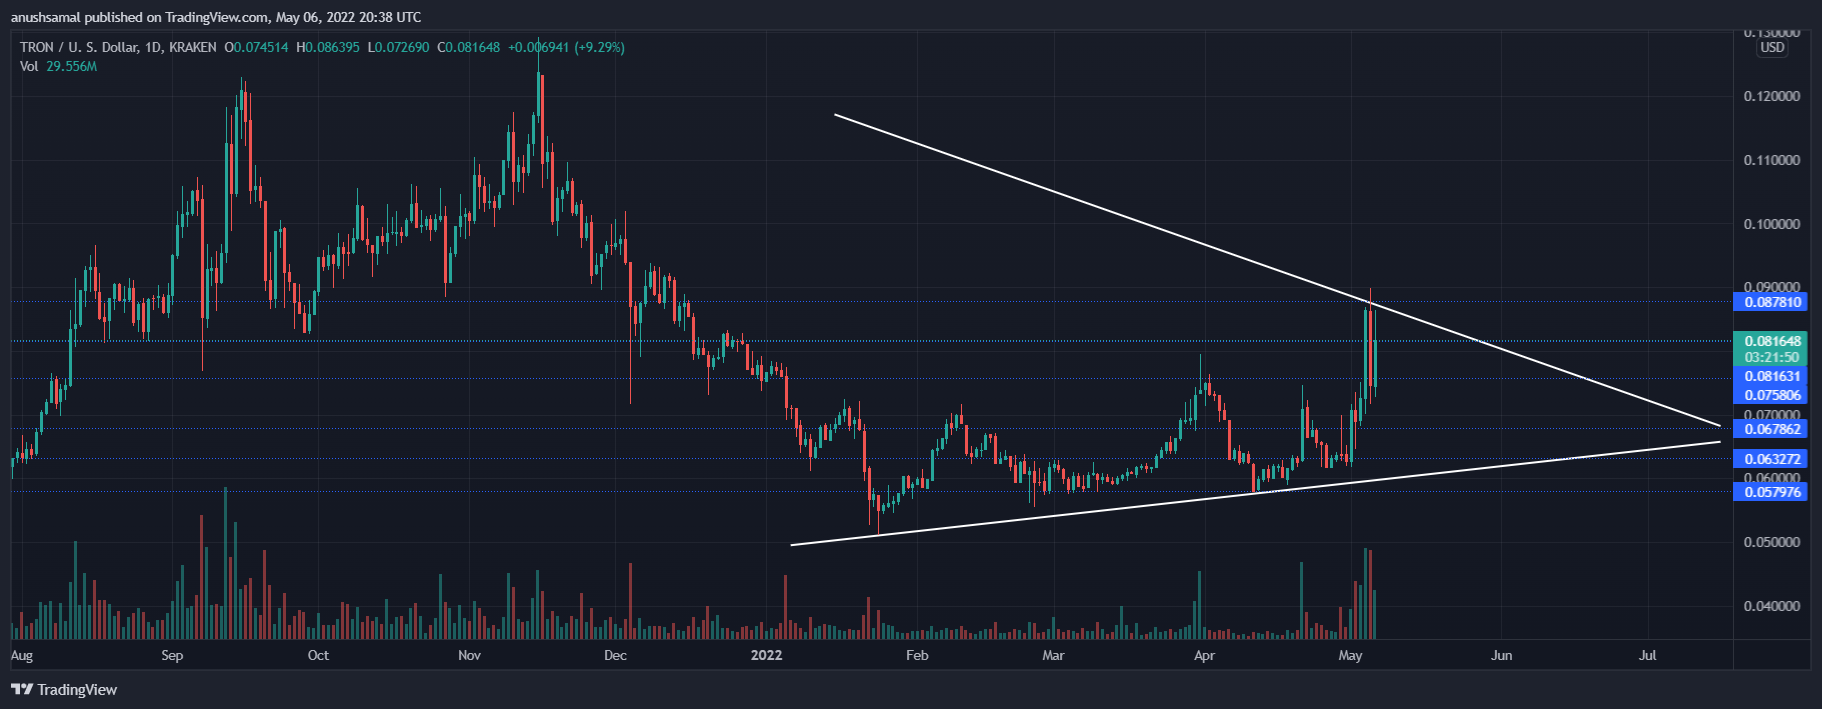
Tron’s price was $0.081 as of the writing. The coin experienced a price pull shortly after reaching the $0.087 resistance level. Profit-taking can be attributed to this pull in prices. This reading is also supported by the large number of buyers on the market.
The coin could fall below the $0.075 level and trade at $0.067. On the upside, if prices don’t correct then TRX might push further up as buyers have flocked the market.
The coin may move towards the $0.090 level in the event of bullish pressure. Positive price action was evident as TRX volume was shown in green.
Technical Analysis
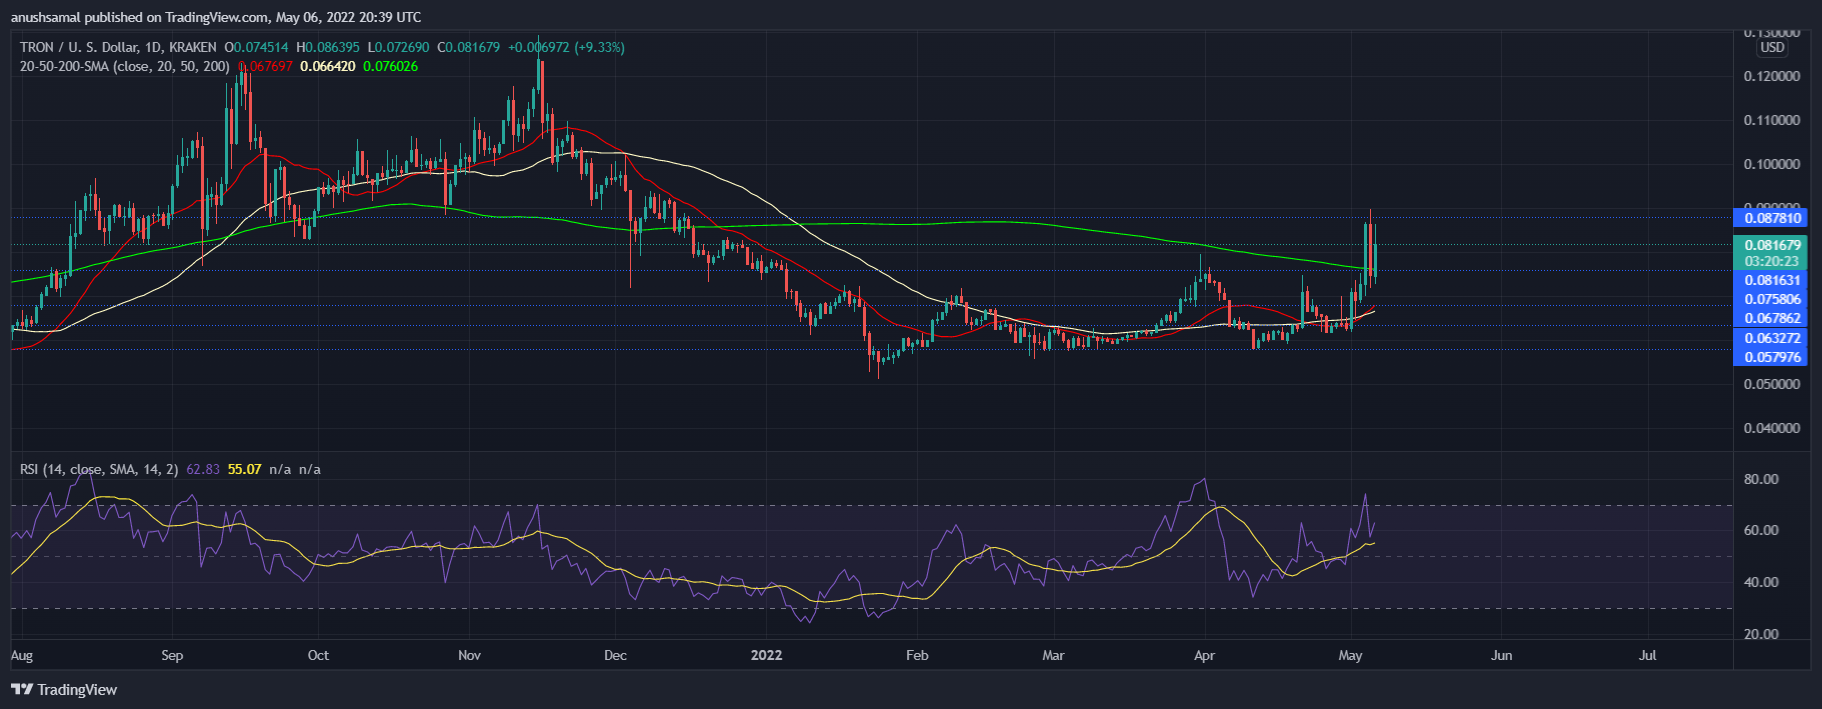
Tron remains bullish in the 24-hour chart. This can be said so because the coin’s prices were seen above the 20-SMA line depicting that buyers drove price momentum in the market. This is another sign that the price action was positive.
TRX also traded higher than the 200-SMA, indicating bullishness at press time. TRX was also shown on the Relative Strength Index. The indicator stood at 60 and showed an increase in buyers. The coin’s previous trading sessions were overbought, which confirms profit-booking.
TRON Joins Stablecoin Wars Will Launch USDD With 30% APY, Here Is When| TRON Joins Stablecoin Wars Will Launch USDD With 30% APY, Here Is When
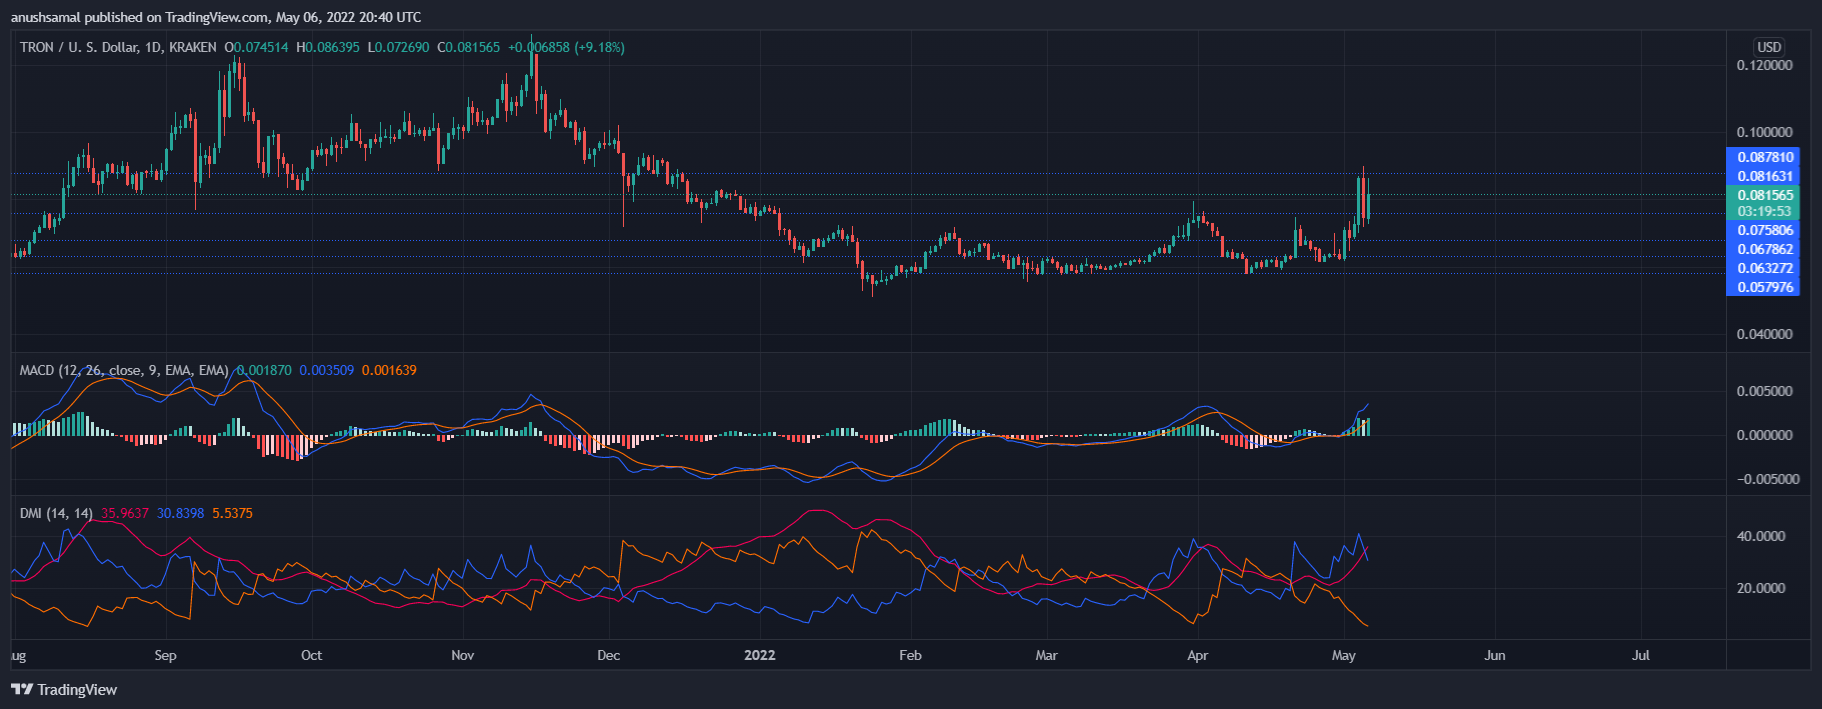
MACD indicated bullish momentum. After a bullish crossover, the indicator flashed green histograms that were growing in size. This indicated that bulls were still in control of the indicator at the time it was being written.
Directional Movement Index (which depicts market momentum) was clearly bullish, as the –DI was below the +DI line in the chart at press-time. It represented bullish price action.
There is a possibility of price pullingbacks after rallies. TRX has seen a price increase of nearly 29% in 24 hours. TRX gained nearly 29% in the past week.
Related Reading: TRONDAO Reserve Appoints Alameda Research the First Member, Whitelisted Institution| TRON DAO Reserve Appoints Alameda Research as the First Member and Whitelisted Institution
Featured Image from UnSplash. Chart from Tradingview.com


