As a result of continued market weakness, Bitcoin was trading at a lower level than its crucial price support over the weekend. Traders’ confidence in the asset has remained quite low considering the selling pressure in the market.
Prices have fallen due to news that the Federal Reserve raised its interest rates. Bitcoin also shows profit booking in charts. It could also be the reason that prices have fallen further. A short-term slide could happen if the asset does not reach the $38,000 level.
Bitcoin currently trades with bearish sentiment. However, charts can tell you something. Numerous bullish divergences have been spotted in charts over different timeframes.
Bullish divergences equal bullish sentiments. These divergences mean that Bitcoin will eventually recover from its immediate resistances and can trade higher in the long-term.
A Day of Bitcoin Price Analysis

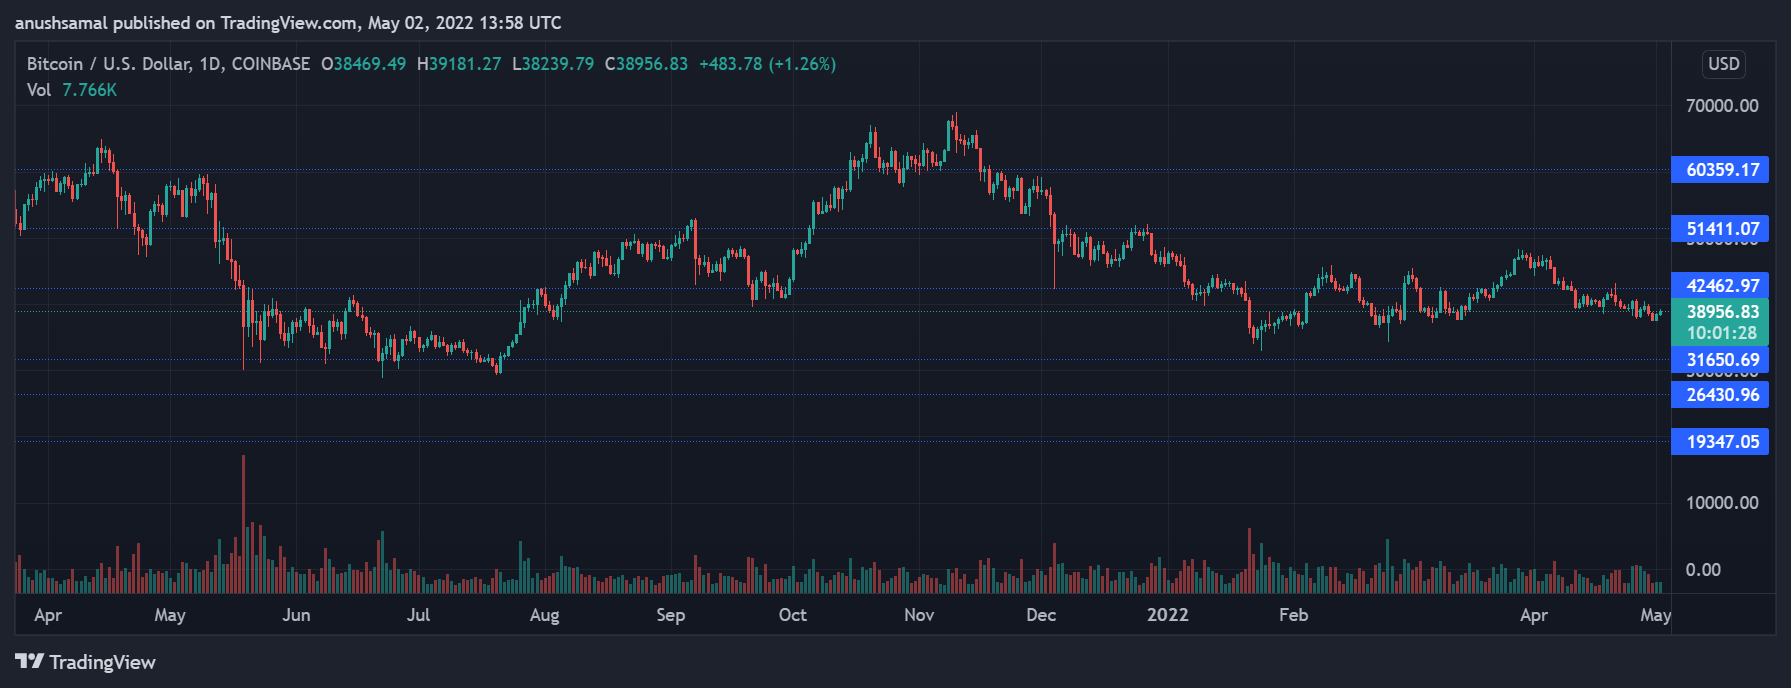
Bitcoin trades at $38,956 when this article was written. The coin’s immediate resistance was $40,000. BTC could trade as close to the $38,000 mark if its price falls below current levels.
BTC could trade at $31,000 if it falls below $38,000 BTC might target $42,000 in the event of a price decline after surpassing $40,000
The Bitcoin volume had fallen in the most recent trading sessions. However, the bars were still in the green. This might indicate that buyers are returning to the market.
Bitcoin Price Continues Struggle, But Miners Refuse To Sell| Bitcoin Price Continues Struggle, But Miners Refuse To Sell
One Day Chart Technical Analysis

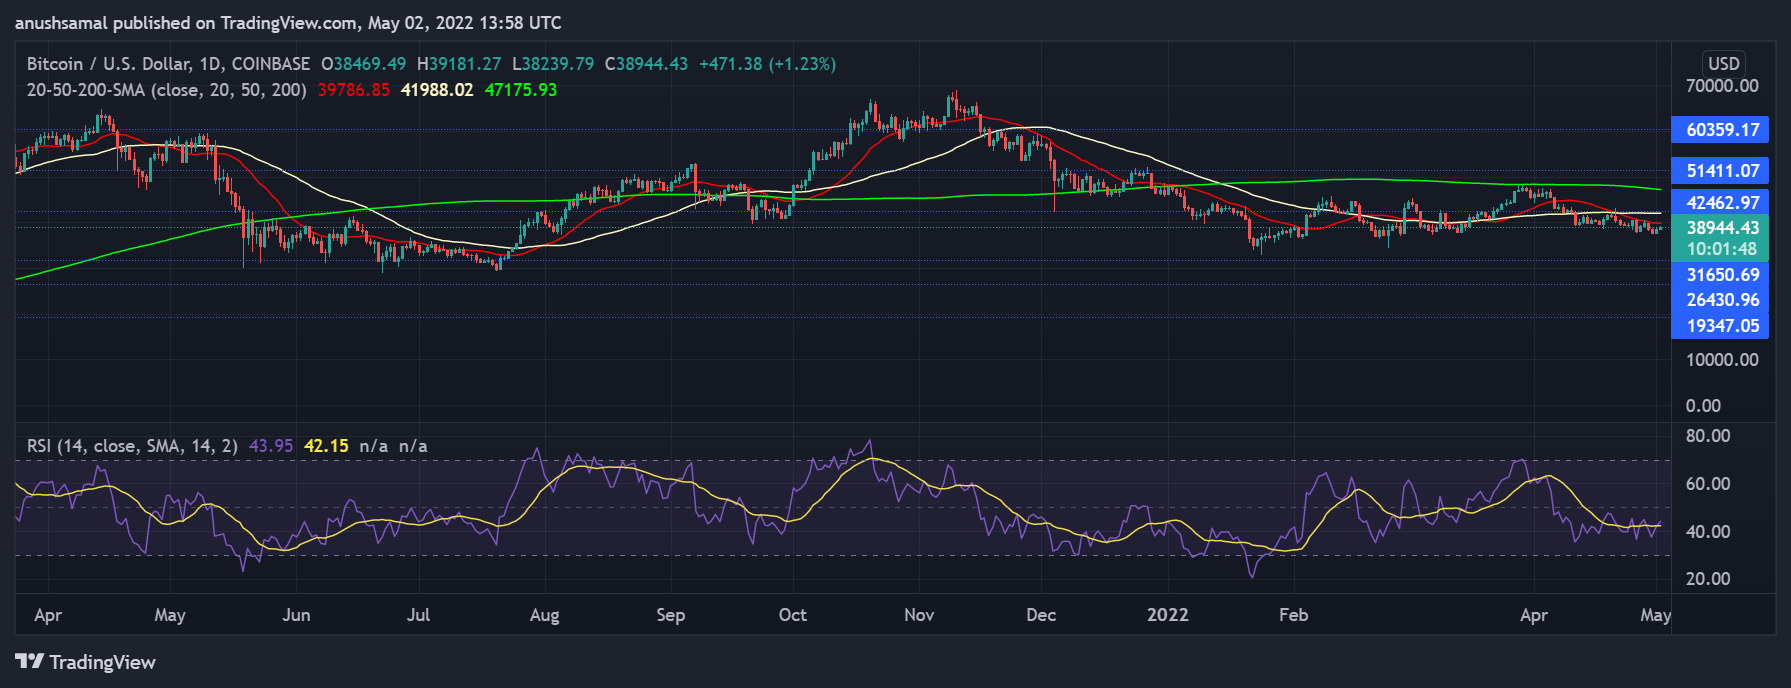
BTC’s price was trading lower than the 20-SMA, which indicated increased selling pressure. Sellers in the market drove price momentum. An increase in buying pressure could push prices higher than the 20-SMA, and then over the 50-SMA.
The Relative Strength Index showed that the indicator fell below the 50-line. If the reading is below 50, it indicates a decline in purchasing strength. Further falling buying pressure has been caused by profit booking. Although the buying power made some recovery efforts, they failed every time.
There was however a slight uptick at press time which indicated that the buying power continued to attempt to recover from the charts.
Bitcoin shows bullish divergences in the one-week chart

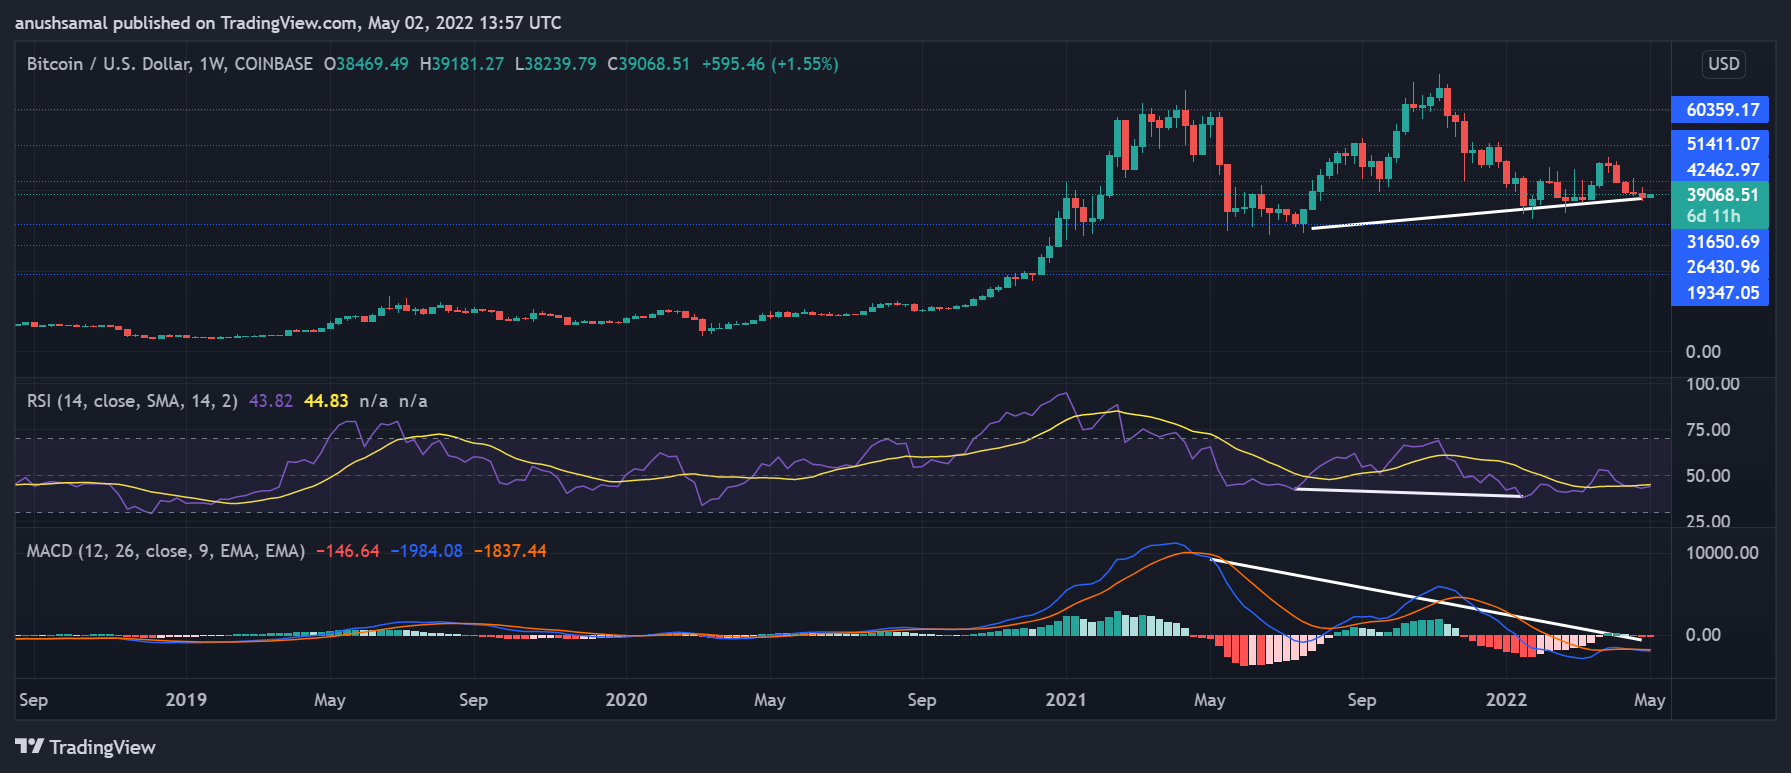
Bitcoin dropped over the weekend. However, BTC was stable for the last 24 hour. The coin has fallen by almost 3% in the last week. One-week charts showed a rise in bullishness. Long-term bullish pressure could see them break through the $38,900 price point.
In the immediate term, bulls could resurface and a support area between $38,000-37,000 would form. This would prevent the coin’s further decline.
On the one-week chart, indicators showed mixed signals. The indicator’s continued bearish bias. Hidden bullish divergences were seen (white) on both the RSI as well as MACD. Positive bullish divergences could be a sign of northbound price movement.
Bullish Indication on The 4-Hour Chart

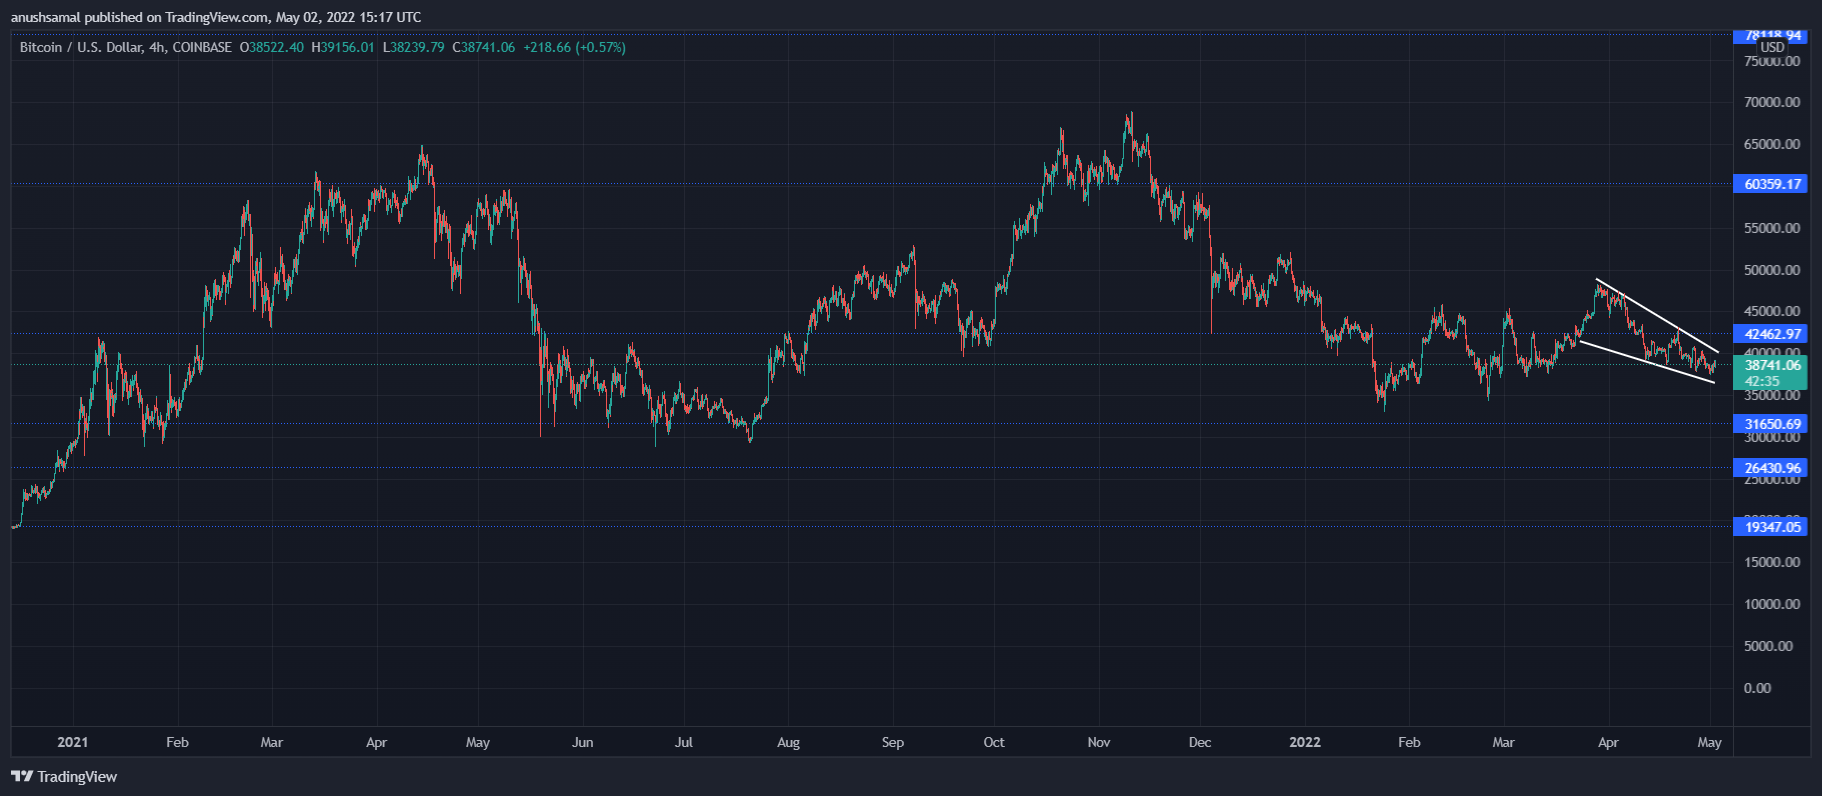
Since mid-April, Bitcoin traded within a downward wedge. A bullish price action is a downward wedge. It is usually tied to a rise in bitcoin prices. Both the one-week and four-hour charts show bullish indications and divergences.
It suggests that prices may be on the rise. In the case of a week’s time frame, both indicators displaying bullish divergences increase the chances of a breakout. BTC maintains a bearish outlook due to falling buying pressure.
TA: Bitcoin Consolidates below $39k: What Can Trigger an Additional Decline| TA: Bitcoin Consolidates Below $39k: What Could Trigger Another Decline
Featured Image from UnSplash. Chart by TradingView.com